We certify that we
have read this thesis and that in our opinion it is satisfactory in scope and
quality as a thesis for the degree of Master of Science in Agronomy and Soil
Science.
|
|
NITROGEN FIXATION IN
FIELD-GROWN LEGUMES MEASURED BY
THE 15N
ISOTOPE DILUTION AND THE DIFFERENCE METHODS
A THESIS SUBMITTED TO THE GRADUATE DIVISION
OF THE
UNIVERSITY OF HAWAII IN PARTIAL FULFILLMENT
OF THE REQUIREMENTS FOR THE DEGREE OF
MASTER OF SCIENCE
IN AGRONOMY AND SOIL
SCIENCE
AUGUST 1986
by
Wilson Emaanzi Kagabo
Thesis Committee:
James A. Silva, Chairman
Paul W. Singleton
Mitiku Habte
We certify that we
have read this thesis and that in our opinion it is satisfactory in scope and
quality as a thesis for the degree of Master of Science in Agronomy and Soil
Science.
|
|
ACKNOWLEDGEMENTS
The author wishes to express his sincere
appreciation to the Liberian and United States Governments for their support
through the scholarship awarded to him.
Special thanks are given to the Director of
Central Agricultural Research Institute Suakoko, Liberia for allowing him to
pursue the graduate study.
Appreciation is also extended to the NifTal
Project of the University of Hawaii for their assistance and the use of their
facilities.
Most of all my appreciation and thanks to my
parents for their encouragement and motivation.
TABLE
OF CONTENTS
Page
ACKNOWLEDGEMENTS
................................................. 3
LIST OF TABLES ................................................... 7
LIST OF FIGURES
.................................................. 11
I. INTRODUCTION
.................................................. 16
II. REVIEW OF LITERATURE
.........................................
19
2.1. Nitrogen Fixation
.....................................
19
2.2. Inoculation
...........................................
19
2.3. Methods of Measuring N2 fixation
...................... 21
2.4. Nitrogen Balance or
Difference Method ................. 21
2.5. The 15N Isotope Dilution method
....................... . 22
2.6. Nitrogen Balance vs the 15N Isotope
Dilution ........... 23
2.7. Residual Nitrogen
.....................................
26
III. FIELD ESTIMATES OF
NITROGEN FIXATION ........................
28
3.1. Materials and Methods
................................. 28
3.1.1. Location and Soils
............................ 28
3.1.2. Land Use
......................................
28
3.1.3. Experimental Design
........................... 28
3.1.4. Treatments
.................................... 29
3.1.5. Inoculation and Planting
...................... 29
3.1.6. Fertilizer and 15N Application
................. 30
3.1.7. Determination of Indigenous Rhizobia in Kuiaha
Soil
........................................... 30
TABLE
OF CONTENTS (continued)
3.1.8. Sampling and Nitrogen Determination
............ 31
3.1.9. Statistical
Analysis ........................... 32
3.2. Results and Discussion
................................. 33
3.2.1. Inoculation Response
........................... 33
3.2.2. Early Yield and Nodulation Indices
............. 33
3.2.3. Evaluation of Reference Crops
.................. 35
3.2.3.1. Total N Uptake
......................... 35
3.2.3.2. Atom % 15N Excess
....................... 37
3.2.3.3. 15N Dilution Method
..................... 42
3.2.3.4. Harvest Date by Reference Crop
Interaction by the 15N Method ........... 42
3.2.3.5. Difference Method
...................... 45
3.2.3.6. Harvest Date by Reference Crop
Interaction by the Difference Method ... 51
3.2.4. Nitrogen Fixation
Estimates by the 15N Method ... 60
3.2.5. N2
Fixation Estimates by the Difference Method..
62
3.2.6. Comparison of the Methods
...................... 64
IV. RESIDUAL NITROGEN
.............................................
76
4.1. Materials and Methods
.................................. 76
4.1.1. Land Preparation ............................... 76
4.1.2. Experimental
Design ............................ 76
4.1.3. Treatment Design
............................... 76
4.1.4. Planting and Management
........................ 76
4.1.5. Harvest and Data
Collection .................... 78
4.2. Results and Discussion
................................. 78
TABLE
OF CONTENTS (continued)
4.2.1. N Yield
........................................
78
V. CONCLUSIONS
.................................................... 81
APPENDICES
........................................................ 83
I
........................................................... 83
II
.......................................................... 84
III
......................................................... 88
IV
.......................................................... 89
V
........................................................... 92
VI
.......................................................... 101
BIBLIOGRAPHY
...................................................... 102
LIST OF TABLES
Table Page
1 Total
N yield and rate of N accumulation (g day-1)
in
field-grown legumes 35 days after emergence ........ 36
2 Effect
of reference crop on N2-fixation estimates
(kg
ha-1) in field-grown legumes as determined by
the
15N isotope dilution method ......................... 43
3 Effect
of reference crop on N2-fixation estimates
(kg ha-1) in
field-grown legumes as determined by
the
15N isotope dilution method ......................... 44
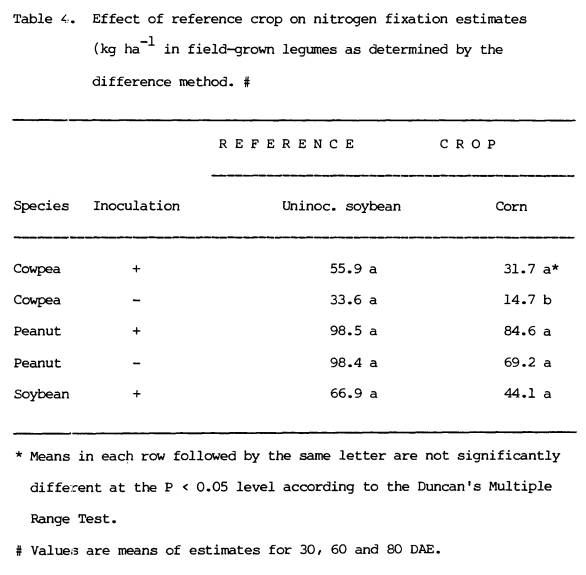
4 Effect
of reference crop on nitrogen fixation estimates
(kg
ha-1) in field-grown legumes as determined by the
difference
method ...................................... 52
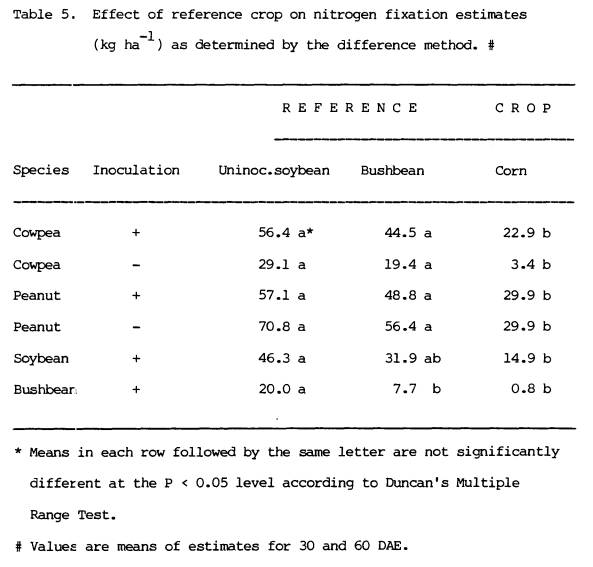
5 Effect
of reference crop on nitrgen fixation estimates
(kg
ha-1) as determined by the difference method ........ 53
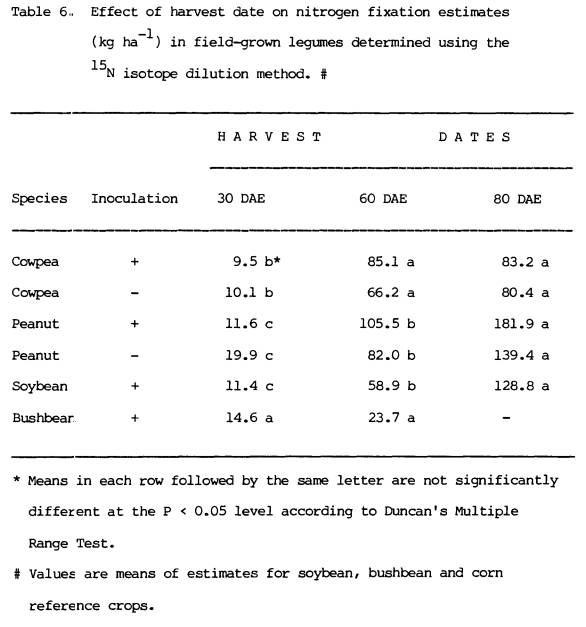
6 Effect
of harvest dates on nitrogen fixation estimates
(kg
ha-1) in field-grown legumes determined using the
15N
isotope dilution method ............................. 61
7 Effect
of harvest dates on nitrogen fixation estimates
(kg
ha-1) in field-grown legumes as determined using
the
difference method .................................. 63
LIST
OF TABLES (continued)
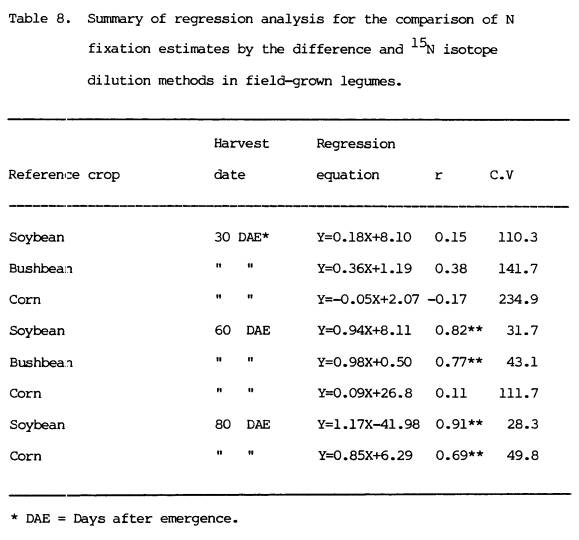
8 Summary
of regression analysis for comparison of N
fixation
estimates by the difference and 15N isotope
dilution
methods in field-grown legumes................. 74
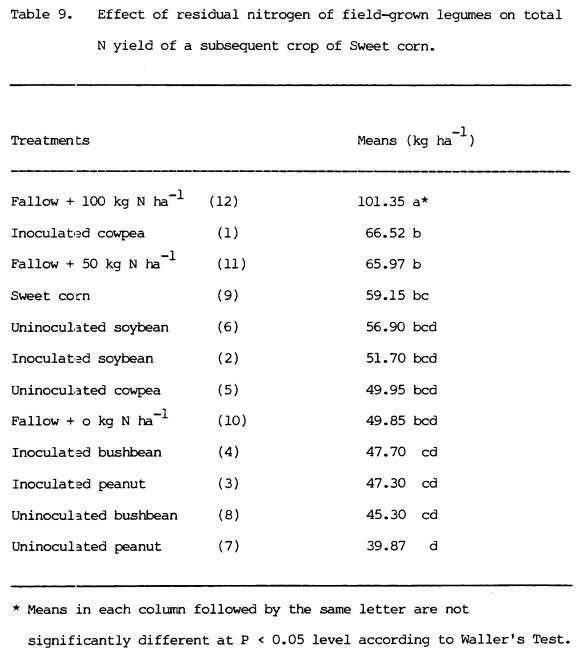
9 Effect
of residual nitrogen of field-grown legumes on
total
N yield of a subsequent crop of sweet corn ....... 80
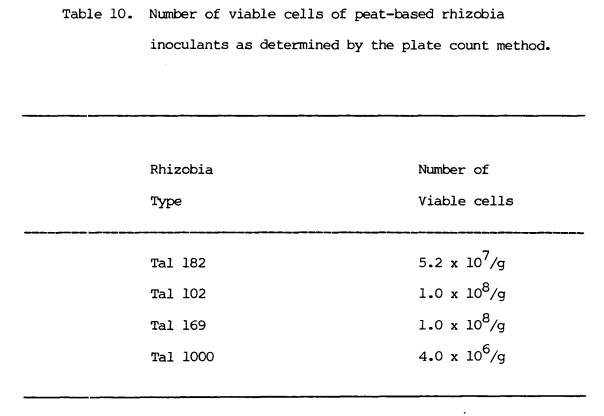
10 Number
of viable cells of peat-based rhizobia
inoculants
as determined by the plate count method ..... 83
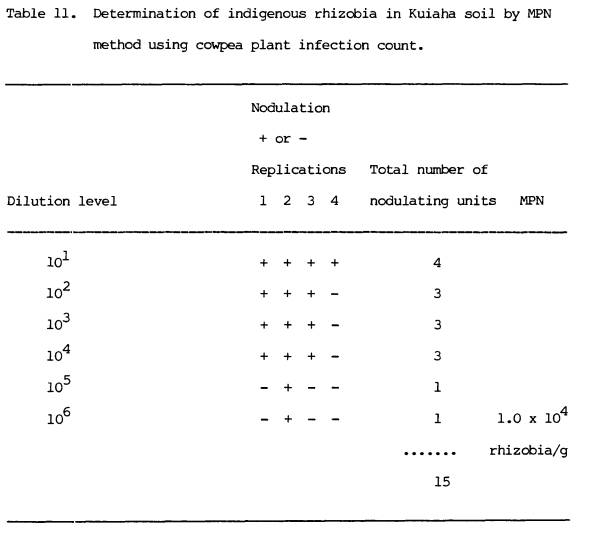
11 Determination
of indigenous rhizobia in Kuiaha soil
by MPN method using cowpea plant infection
count ....... 84
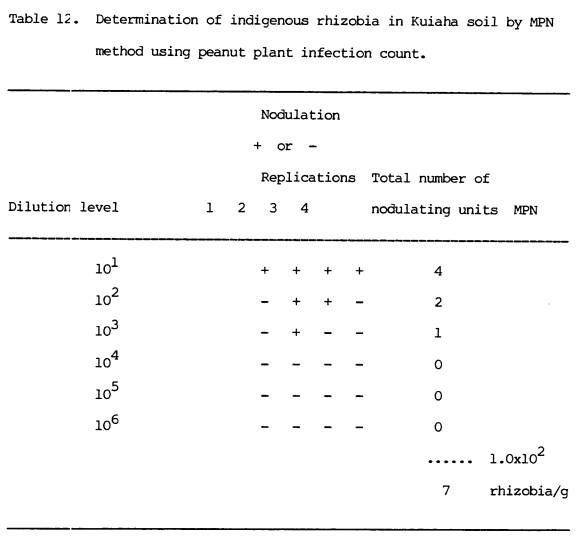
12 Determination
of indigenous rhizobia in Kuiaha soil
by MPN method using peanut plant infection
count ....... 85
13 Determination
of indigenous rhizobia in Kuiaha soil
by MPN method using soybean plant infection
count ...... 86
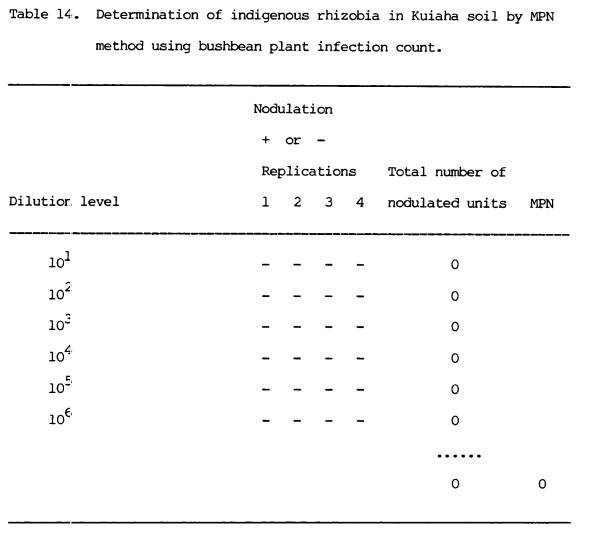
14 Determination
of indigenous rhizobia in Kuiaha soil
by MPN method using bushbean plant infection
count ..... 87
15 Early
dry matter yield, percent N, nodule count and
dry weight in field-grown legume species
............... 88
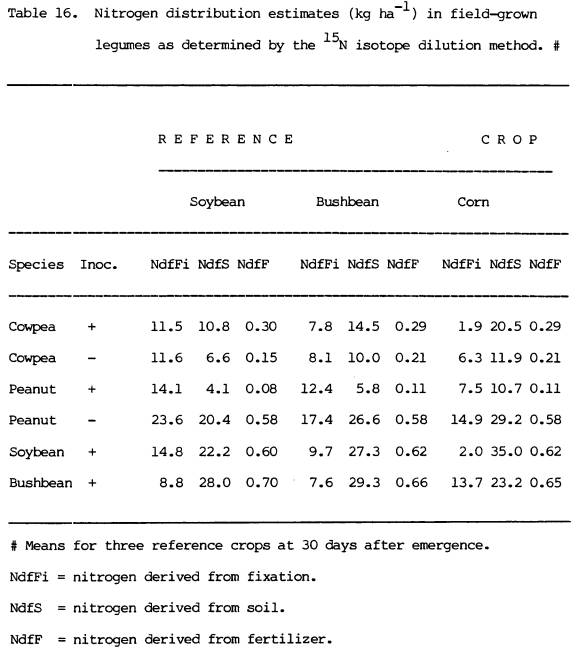
16 Nitrogen
distribution estimates (kg ha-1) in
field-grown legumes as determined by the 15N
isotope
dilution method ........................................
89
LIST OF TABLES
(continued)
17 Nitrogen
distribution estimates (kg ha-1) in
field-grown
legumes as determined by the 15N isotope
dilution
method ....................................... 90
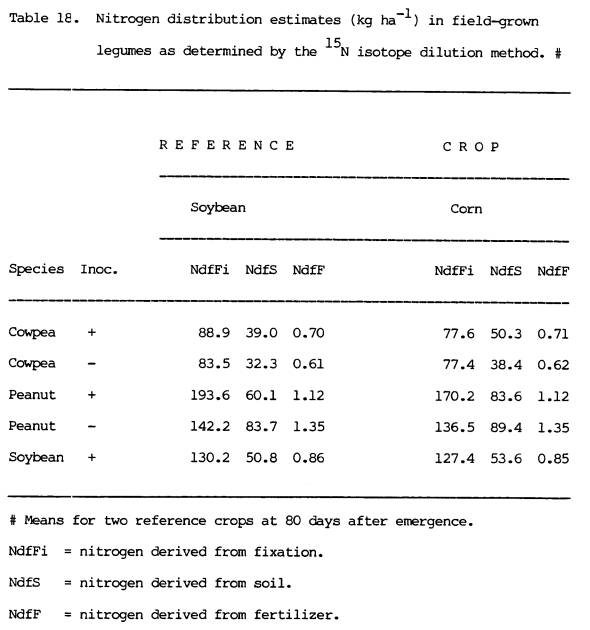
18 Nitrogen
distribution estimates (kg ha-1) in
field-grown
legumes as determined by the 15N isotope
dilution
method ....................................... 91
19 Dry
matter yield of field-grown legumes and sweet corn
(kg ha-1) 30 days after emergence
...................... 92
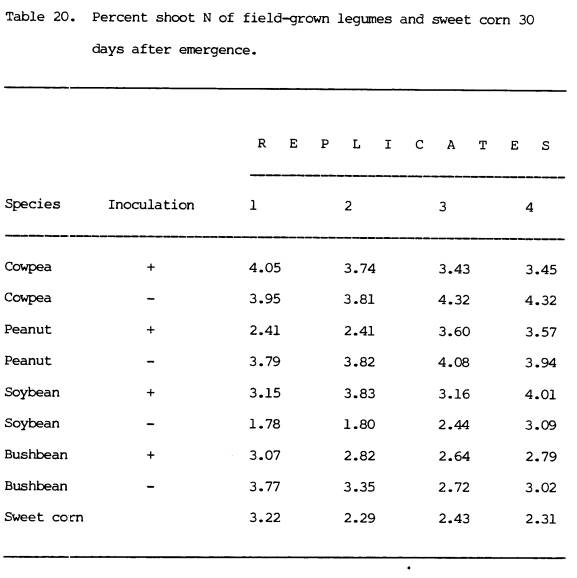
20 Percent
shoot N of field-grown legumes and sweet corn
30 days after emergence.
.............................. 93
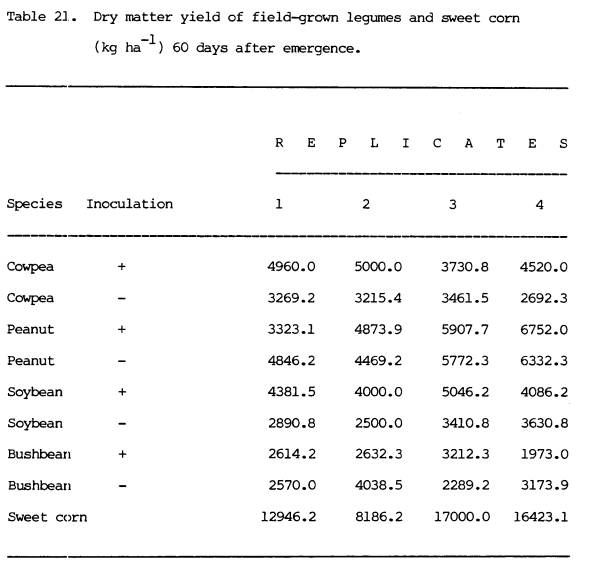
21 Dry
matter yield of field-grown legumes and sweet corn
(kg
ha-1) 60 days after emergence ...................... 94
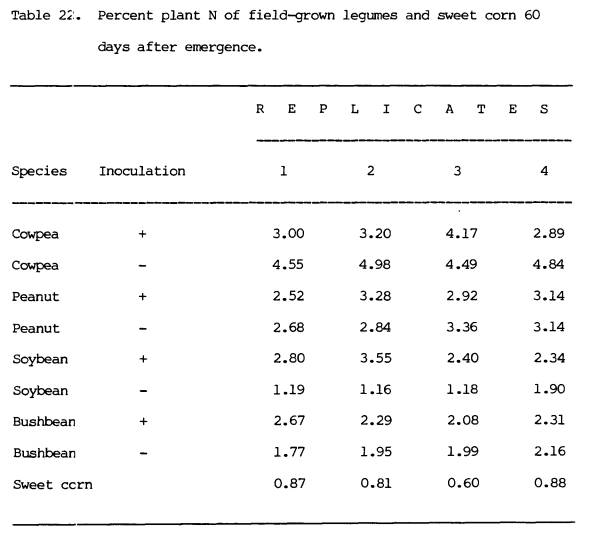
22 Percent
plant N of field-grown legumes and sweet corn
60 days after emergence.
.............................. 95
23 Dry
matter yield of field-grown legumes and sweet corn
(kg ha-1) 80 days after emergence
...................... 96
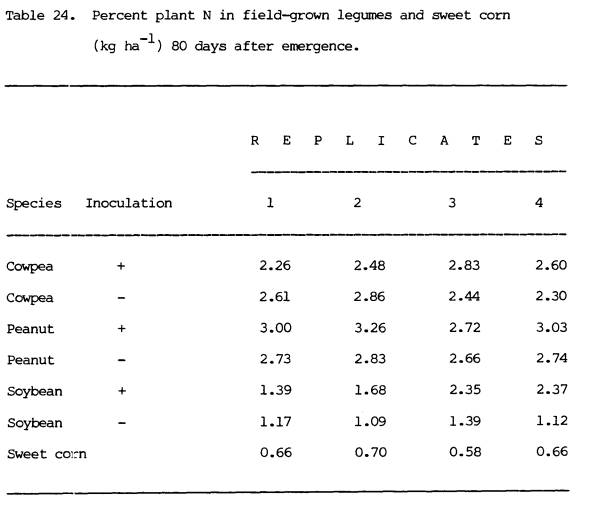
24 Percent
plant N in field-grown legumes and sweet corn
(kg ha-1) 80 days after
emergence ...................... 97
LIST OF TABLES
(continued)
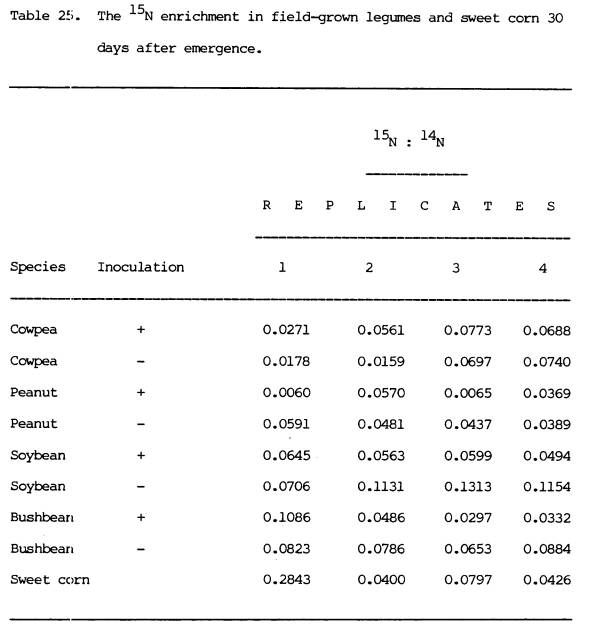
25 The
15N enrichment in field-grown legumes and
sweet
corn 30 days after emergence .................... 98
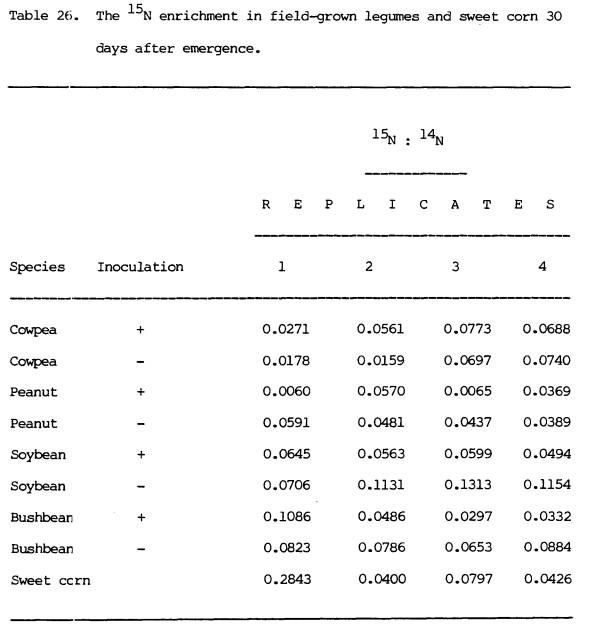
26 The
15N enrichment in field-grown legumes and
sweet
corn 60 days after emergence .................... 99
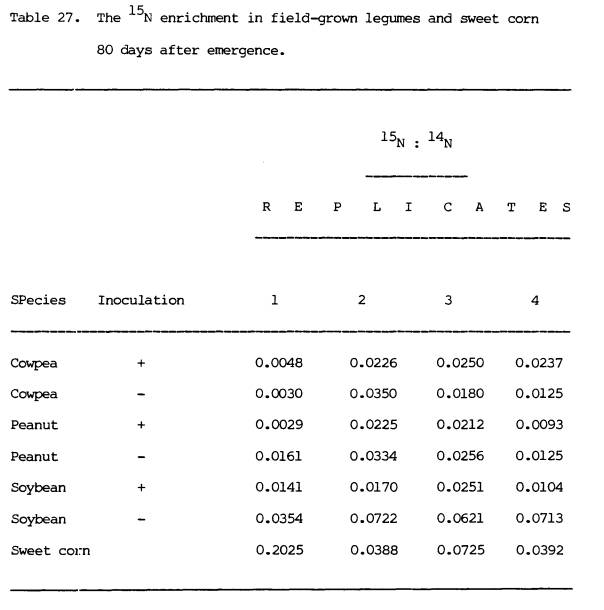
27 The
15N enrichment in field-grown legumes and
sweet corn 80 days after emergence
.................... 100
LIST OF FIGURES
Figure Page
1 Effect
of inoculation on N yield in field-grown
legume
species at 30, 60, and 80 days after
emergence
............................................. 34
2 Total
N yield of three reference crops at 30, 60, and
80
days after emergence ............................... 38
3 15N
enrichment in non-fixing soybean, bushbean, and
corn
reference crops .................................. 39
4 15N
enrichment in field-grown N fixing legumes ......... 40
5 Total
N yield (kg ha-l) in field-grown legumes and
corn
.................................................. 41
6 Effect
of harvest date and reference crop on N
fixation estimates for inoculated cowpea
calculated
using the 15N method
with soybean and corn as reference
crops
................................................. 46
7 Effect
of harvest date and reference crop on N
fixation
estimates for uninoculated cowpea calculated
using
the 15N with soybean and corn as reference
crops
................................................. 47
LIST
OF FIGURES (continued)
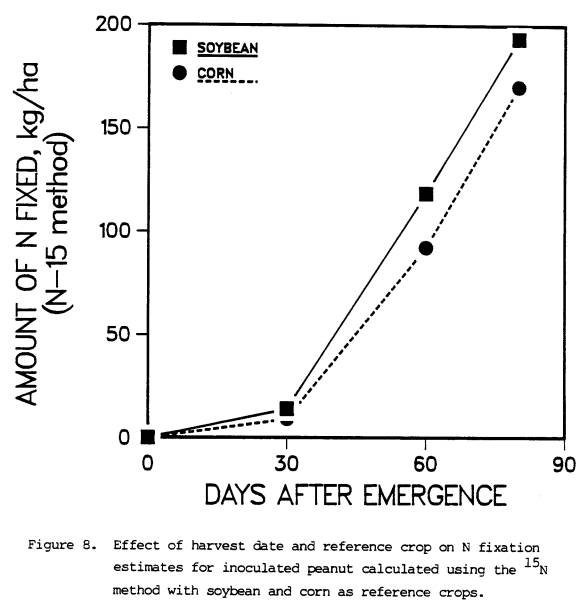
8 Effect
of harvest date and reference crop on N
fixation estimates for inoculated peanut
calculated
using the 15N method
with soybean and corn as reference
crops
.................................................. 48
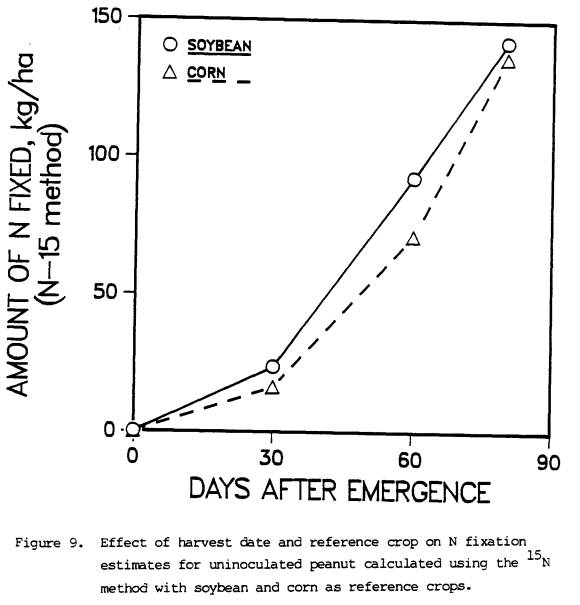
9 Effect
of harvest date and reference crop on N
fixation
estimates for uninoculated peanut calculated
using
the 15N method with soybean and corn as reference
crops
.................................................. 49
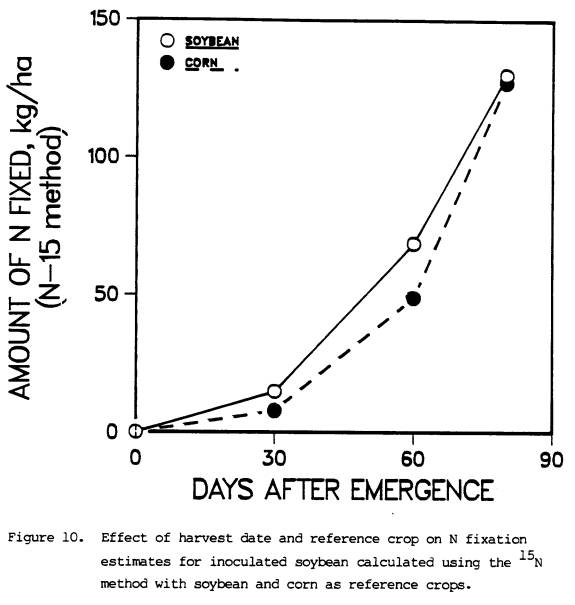
10 Effect
of harvest date and reference crop on N
fixation estimates for inoculated soybean
calculated
using the 15N method
with soybean and corn as reference
crops
.................................................. 50
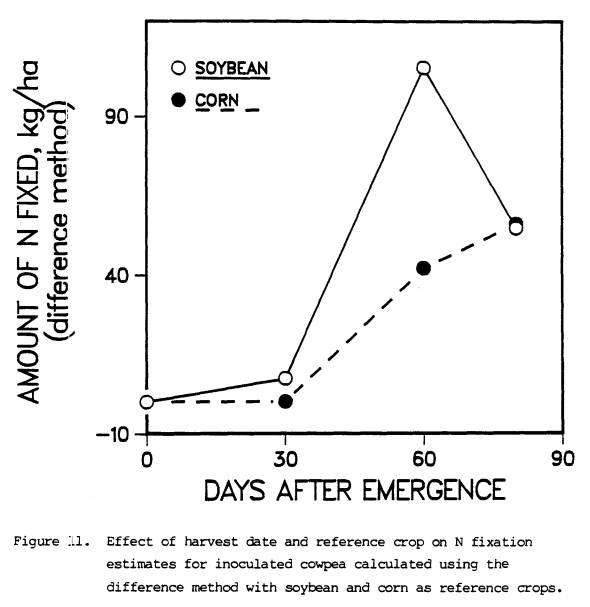
11 Effect
of harvest date and reference crop on N
fixation
estimates for inoculated cowpea calculated
using
the difference method with soybean and corn as
reference crops
........................................ 55
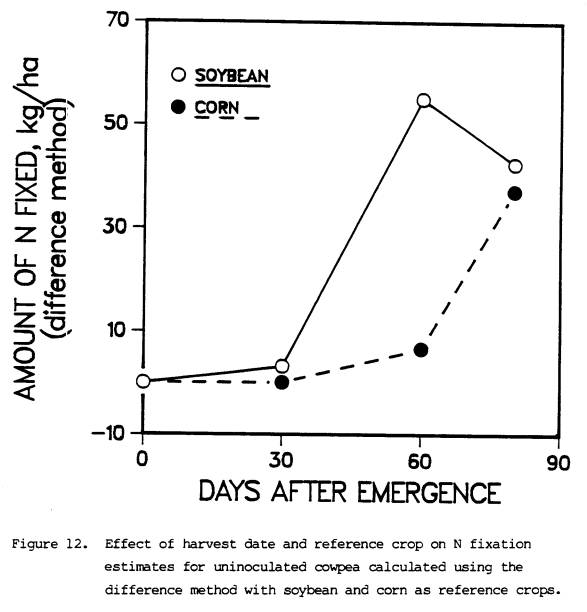
12 Effect
of harvest date and reference crop on N
fixation estimates for uninoculated cowpea
calculated
using the difference method with soybean and
corn as
reference crops
........................................ 56
LIST
OF FIGURES (continued)
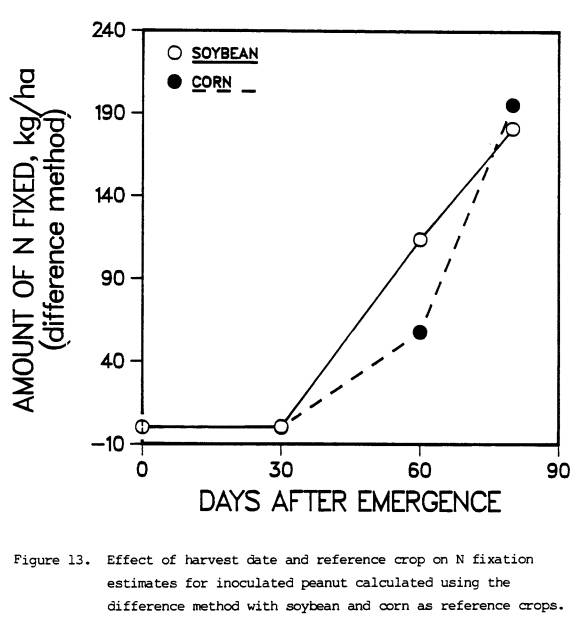
13 Effect
of harvest date and reference crop on N
fixation
estimates for inoculated peanut calculated
using
the difference method with soybean and corn as
reference crops
........................................ 57
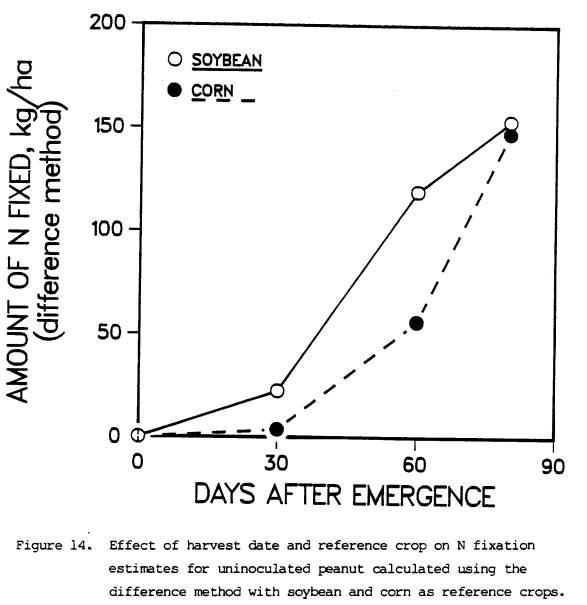
14 Effect
of harvest date and reference crop on N
fixation estimates for uninoculated peanut
calculated
using the difference method with soybean and
corn as
reference crops ........................................
58
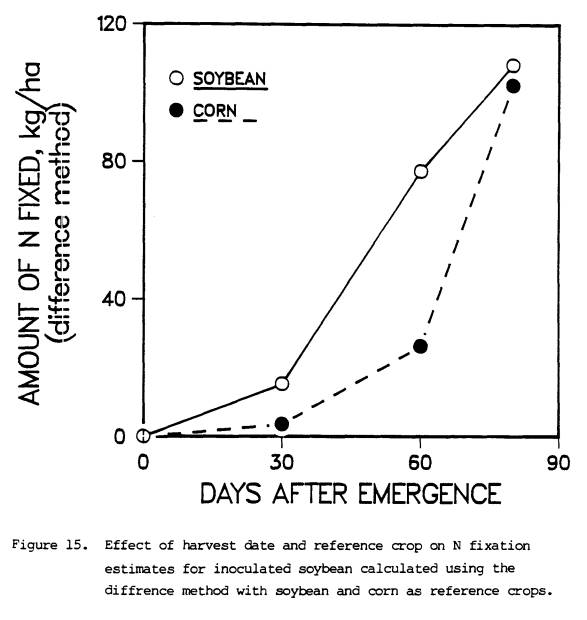
15 Effect
of harvest date and reference crop on N
fixation
estimates for inoculated soybean calculated
using
the difference method with soybean and corn as
reference
crops ........................................ 59
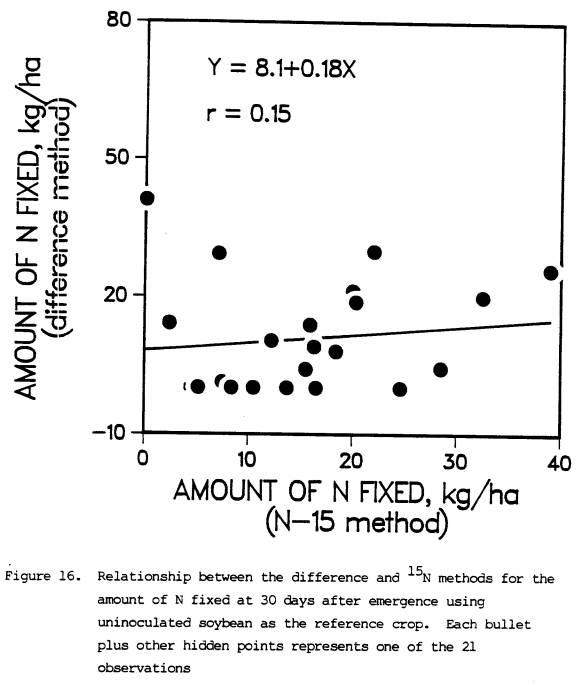
16 Relationship
between the difference and 15N methods
for
the amount of N fixed at 30 days after emergence
using
uninoculated soybean as the reference crop.
Each
bullet represents one of the 21 plus other hidden
individual
observations ............................... 65
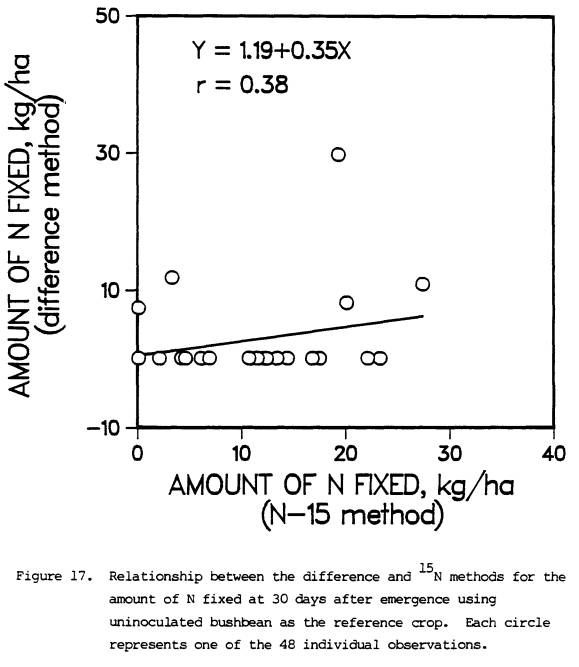
17 Relationship
between the difference and 15N methods
for the amount of N fixed at 30 days after
emergence
using uninoculated bushbean as the reference
crop.
Each circle represents one of the 48
individual
observations ...........................................
66
LIST
OF FIGURES (continued)
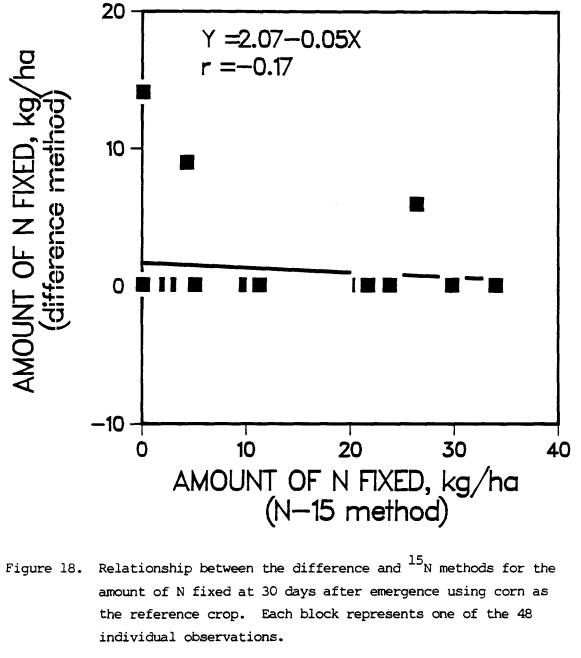
18 Relationship
between the difference and 15N methods for
the
amount of N fixed at 30 days after emergence using
corn
as reference crop. Each block
represents one of
the
48 individual observations ........................ 67
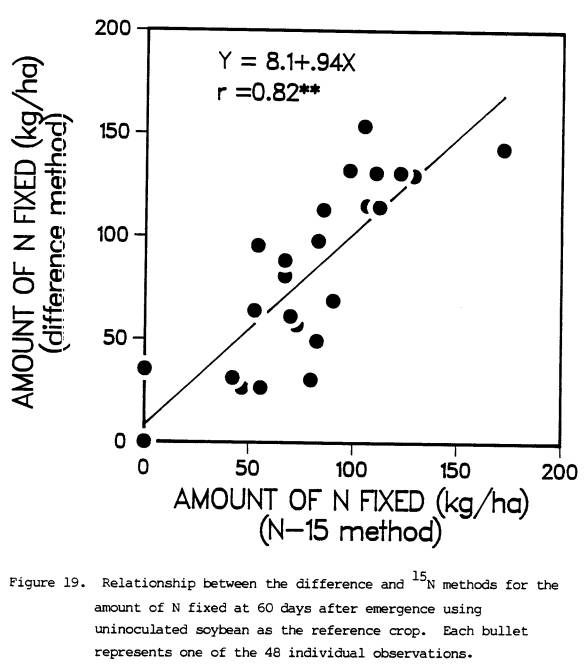
19 Relationship
between the difference and 15N methods for
the
amount of N fixed at 60 days after emergence using
uninoculated
soybean as the reference crop. Each bullet
represents
one of the 48 individual observations ...... 68
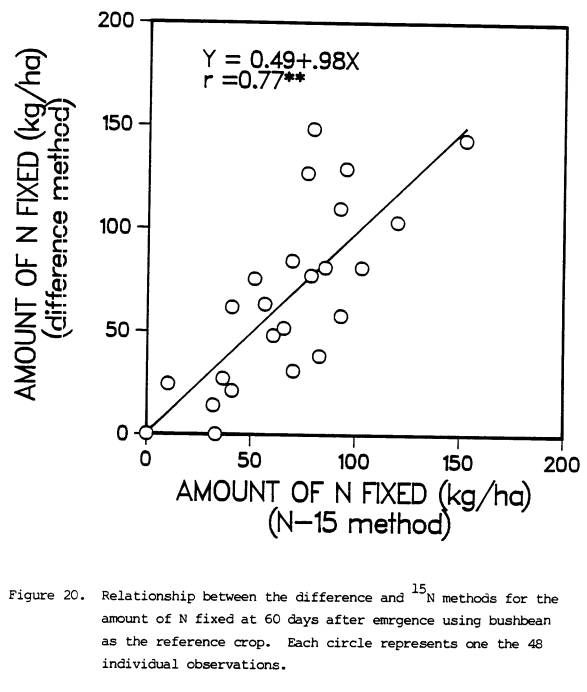
20 Relationship
between the difference and 15N methods for
the
amount of N fixed at 60 days after emergence using
bushbean
as the reference crop. Each circle
represents
one
of the 48 individual observations ................. 69
21 Relationship
between the difference and 15N methods for
the
amount of N fixed at 60 days after emergence using
corn
as the reference crop. Each block
represents one
of the 48 individual observations
...................... 70
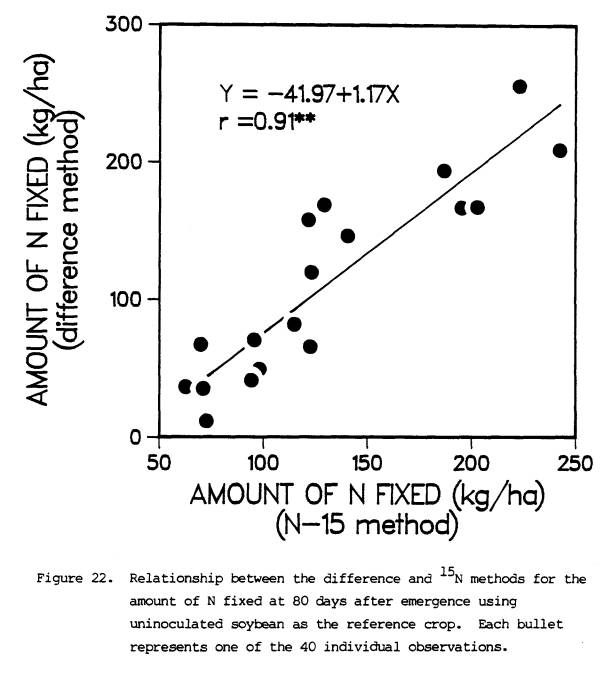
22 Relationship
between the difference and 15N methods for
the
amount of N fixed at 80 days after emergence using
uninoculated
soybean as the reference crop. Each
bullet
represents one of the 40 individual
observations ....... 72
LIST OF FIGURES
(continued)
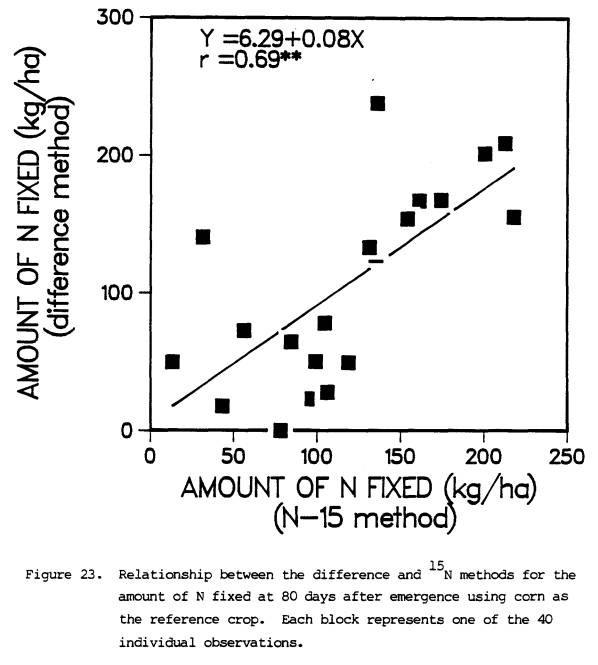
23 Relationship
between the difference and 15N methods for
the amount of N fixed at 80 days after
emergence using
corn as the reference crop. Each block represents one
of the 40 individual observations
...................... 73
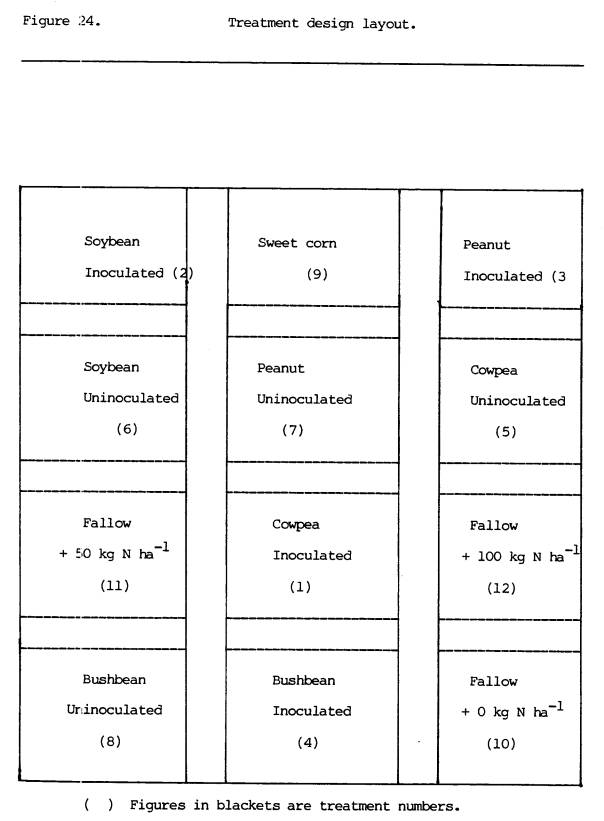
24 Treatment
design layout ................................ 77
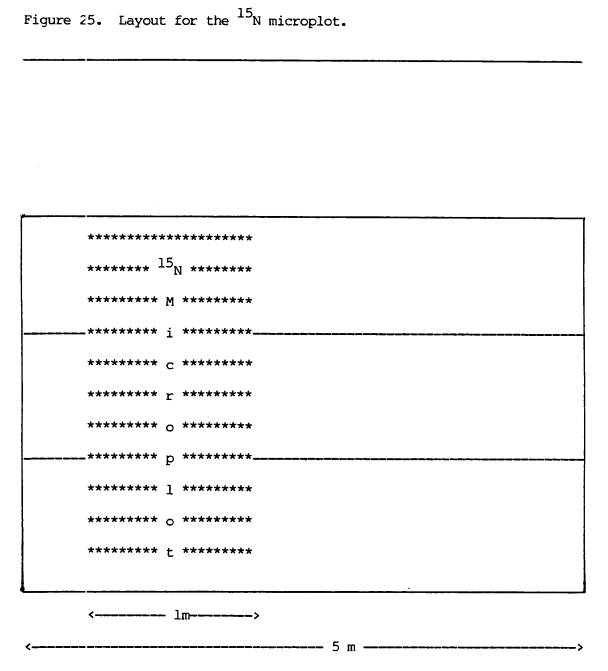
25 Layout
for the 15N microplot ............................ 101
I. INTRODUCTION
Legume crops are important because of their
ability to fix atmospheric nitrogen through symbiosis with rhizobia. In the tropics where the majority of the
population obtains its living from the land, legumes are likely to increase in
importance. Legumes form a major
component of tropical agrosystems (Norman, 1982; Rachie, 1977; and Okigbo, 1977)
and can provide cash income to the farming community. Food legumes provide large quantities of good quality dietary
protein to the population and legumes also help to maintain a reasonable level
of soil fertility.
Cropping systems involving monoculture of
non-leguminous plants cause a decline of yields and depletion of soil
nitrogen. This decrease in productivity
in the past, especially in tropical Africa, has been alleviated by shifting
cultivation or more recently by the use of inorganic fertilizers. As the population increases, the resulting
pressure on the land has made shifting cultivation untenable. Recent increases in prices of synthetic
fertilizer have also made it difficult for small farmers to use inorganic
nitrogen for crop production.
Consequently, biological nitrogen fixation becomes the only alternative
source of nitrogen for crop production.
If biological nitrogen fixation by legumes is
to become a sustained reliable source of nitrogen for crop production, certain
questions have to be answered. How much
nitrogen do various legumes fix? How
much residual nitrogen do legumes supply to the cropping systems? However, these questions and many others can
not be answered without a reliable method to estimate biological nitrogen
fixation. Reliable estimates of
biological nitrogen fixation will allow selection of superior N2-fixing
legume species. Gibson et al. (1977)
for instance, indicated that biological nitrogen fixation (BNF) can be improved
by: (1) growing better cultivars adapted to specific environments, (2)
inoculation with the most effective and competitive strains of Rhizobia, and
(3) the application of management practices designed to minimize the impact of
nutritional and environmental limitations.
Literature suggests that there are several
methods that can be used to estimate field N2-fixation. The 15N isotope
dilution and the difference methods are among the most widely used for
estimating field nitrogen fixation by legumes.
There are advantages and disadvantages associated with each method. The
advantage of the difference method is that, it is inexpensive, simple and does
not require special techniques and equipment which are needed for the 15N
isotope dilution method.
The 15N isotope
dilution method which was first described by MacAuliffe et al. (1958) has been
used recently by many workers (Fiedler et al., 1972; Fried et al., 1977; Vose
et al., 1981; Rennie et al., 1982; Rennie and Kemp, 1983 a,b; Rennie et al.,
1984; Rennie and Dubetz, 1984) to estimate field N2-fixation by
various legumes. The advantage of the 15N
isotope dilution method is that it makes it possible to separate N taken
up by the plant from fertilizer and soil from that fixed in the plant. Many workers have described the 15N
isotope dilution method as the most reliable measure of N2-fixation
(Gibson et al., 1977; Amarger et al., 1979; Larue and Patterson, 1982). The accuracy of either method depends on the
type of reference crop used. The best
reference crop should be closely related to the test plant. This can be either
an uninoculated plant, a non-nodulating isoline, or a cereal such as corn. An assumption in all cases is that the test
plant and control both have the same root systems exploring the same volume of
soil. In soils where native rhizobia do
not nodulate the test plant, the ideal reference crop is the uninoculated test
plant. Where the native rhizobia
nodulate the test plant however, the appropriate reference crop is not readily
apparent. It is also not clear whether
there is agreement between the 15N isotope dilution and
the difference methods.
Although there are many problems associated
with the measurement of the gross amount of N fixed by a legume over the whole
period of its growth, the residual nitrogen contribution to the soil-plant
system can be determined through a series of measurements including the portion
of N derived from mineralization, the residual N that was taken up by the
plant, and the portion that remains in the soil.
The objectives of this study were to: (1)
determine the relationship between the 15N isotope dilution
and the difference methods, (2) investigate the field inoculation response of
field-grown legumes, (3) quantify the amount of nitrogen fixed by each species
using the two methods, (4) determine the best reference crop for N fixation
estimates in cowpea and peanut, and (5) determine the residual nitrogen
contribution to a subsequent corn crop.
II. REVIEW OF LITERATURE
2.1. Nitrogen
Fixation
Although
peanut is a leading legume crop in most tropical countries, little information
regarding its nodulation is available.
It is known that about 30% of the cowpea group of rhizobia nodulate
peanut effectively and the remainder are ineffective (Dobereiner 1977). The amount of N2 fixed has not
been determined, but effective nodulation of naturally-occurring peanut strains
has been studied. In West Africa
effective nodulation was observed to occur only during the second year of
cultivation. Sen et al. (1981) observed
that values for acetylene reduction activity and nitrogen accumulation in the
plant top per unit nodule mass of peanut were several times higher than values
for cowpea and siratro. They also
reported a 30% increase in shoot weight, a 125% increase in nitrogenase
activity, a 112% increase in nodule number and a 19% inoculant recovery in
inoculated peanut following amendment of the soil to raise pH from 4.6 to
6.5. However, increasing pH to 7.1
caused these values to decrease. Liming
to such a high pH reduces the availability of most micronutrients some of which
are essential for nitrogen fixation.
The author further observed significant differences among cultivars in
nitrogen fixation and accumulation in stems and leaves. Graham et al. (1981) recommended the use of strains
which function well at a specific pH.
The findings by these workers emphasize the importance of soil reaction
on N fixation.
2.2. Inoculation
Hadad
et al. (1982), observed little benefit from inoculating peanut. Nambiar et al.
(1983), working with peanut, observed that in the field, where inoculated
strains have to compete with the native rhizobium population, the number of
rhizobia required to produce maximum nodulation is likely to be larger than
that needed under glasshouse conditions.
In another study, Nambiar et al. (1982) observed that inoculation of
peanut seeds with liquid culture applied to the soil below the seed proved
superior to either granular or conventional slurry inoculation. Liquid inoculant enhanced germination of
seedlings and resulted in significantly enhanced grain yields.
Grown mainly in Africa and South America,
cowpeas nodulate apparently effectively in most areas without inoculation. Kang et al., (1977), while working with
cowpea in western Nigeria, did not find any need for inoculation as indigenous
strains were capable of good nodulation.
Mughogho et al. (1982) reported that yield responses to both fertilizer
nitrogen and rhizobium inoculation in cowpea were small, indicating that
factors other than nitrogen supply were limiting yield. These findings indicate the need to study
inoculation response in cowpea under tropical soils.
Soybeans, while reported or known to be
sub-tropical plants, have been extended into tropical areas by recent breeding
programs. Dobereiner et al. (1977)
reported that inoculation of soybean is essential in new areas and in acid
soils. They further stated that
selection of the appropriate rhizobium strains is essential for new cultivars
and consideration must be given to the soil and climate into which the crop is
being introduced. Nelson et al. (1980)
however, reported total plant nitrogen of 75 kg ha-l in a
non-nodulating isoline and more than 300 kg ha-1 in a nodulating
isoline. Philip et al. (1975) reported
that successful introduction of soybean in the tropics will depend on
successful inoculation, since it is widely known that yields are closely
correlated with amount of nitrogen accumulated throughout its life cycle. Vest (1971) observed that non-nodulating
soybean genotypes benefited from being grown with nodulating types. Benefits were increase in seed weight and
seed number, probably through utilization of nitrogen fixed by the nodulating
line. Lathwell et al. (1952) reported that high levels of nitrogen must be
available during the bloom period to obtain maximum pod set in soybean. Bhangos et al. (1976) observed that since
soybean can utilize both soil nitrogen and symbiotically fixed nitrogen,
evaluation of nitrogen fixation by soybean, under field conditions, is
difficult since the amount of symbiotically fixed nitrogen decreases with an
increase in available soil nitrogen or applied nitrogen.
2.3. Methods
of measuring N2 fixation
Acetylene reduction assay is one of the
several methods used to measure N2 fixation by crops. However, this method is one-time estimate of
fixation and can not be used to measure N fixation integrated over time. Indices of nodulation, number of nodules,
fresh and dry weight of nodules, leghemoglobin concentration in nodules or per
plant may be related to nitrogen fixation within a single cultivar. However, there is no evidence that these
nodule-related characters can be used to measure the amount of N2-fixation
by crops. Other methods include the concentration of the ureides allantoic acid
and allantoin in the shoots of N fixing legumes. These have been reported to correlate well with the amount of
nitrogen fixed by legumes. However,
more information is still needed as regards the ease and accuracy of this
method. Other methods include the difference or the nitrogen balance and the
isotopic methods.
2.4. Nitrogen
Balance or the Difference Method
The simplest method used to estimate the
amount of nitrogen fixed is by the total nitrogen accumulation in the
crop. The total N content of the
non-fixing crop (derived solely from soil N) is subtracted from the total N
content of the N-fixing legume. Three
versions of the difference method are commonly used. (1) comparison of a legume with a nonlegume, (2) comparison of a
legume with a nonnodulating legume, and (3) comparison of inoculated and
uninoculated legumes. An assumption in
the use of total N to determine the amount of nitrogen fixed is that the test
plant and the control plant both have similar patterns of soil N uptake. However, information to date shows that at
low levels of soil nitrate, nodulating plants exhibit higher nitrate reductase
activity than non-nodulating plants (Harper, 1974). The author concluded that N fixation could not be estimated by
the comparison of nodulating and non-nodulating isolines at low nitrate level
as the latter were stunted, because nitrate utilization was impaired.
Larue et al. (1981) indicated that a closer
approximation to N fixed using nitrogen balance may be achieved by analyzing
changes in soil N as well as that removed in the crop. An adjusted measure of N2
fixation by the nitrogen accumulation technique is obtained when the
contribution of soil N to the total N of legumes is estimated. These findings indicate that nitrogen
fixation can not be estimated by the difference method using non-nodulating
isoline as reference crop at low nitrate level.
2.5. The
15N Isotope Dilution Method
The 15N isotope
dilution method, like the difference method, requires a non-fixing control to
estimate the relative contribution of soil and fertilizer N. In this method the fixing crop and a
non-fixing control are grown in soil to which 15N has
been added as a small amount of labeled nitrate or ammonium. Many workers reported that the 15N
isotope dilution method is more accurate than the difference method. Vose et al. (1981) reported that the
advantage of using 15N in quantifying N2-fixation
is that one can separate the effects of fertilizer and soil N on nitrogen
fixation. It is also possible to
separates the effects of agronomic practices which may affect yield in ways
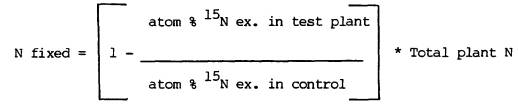
other than nitrogen fixation. Fried et al. (1977) indicated that to determine
the amount of nitrogen fixed by a legume using the 15N isotope
dilution method, it is necessary to apply 15N labeled
fertilizer to both the N2-fixing and the non-fixing plants. Then the atom % 15N excess
in both plants are determined. The
amount of N2-fixed can then be calculated from the following
equation:
Amarger et al. (1979) indicated that when
nitrogen fixation activity of nodulated plants varies, either because of the
variety, level of fertilizer N or the time samples were taken, a proportional
variation of isotopic N composition is
observed. These variations are
incorporated in the estimates of the proportion of nitrogen fixed, which is
justified. They further reported that inoculation
of soybean led to a decrease in the soil-derived N uptake and a lower 15N
content in the nodulated than non-nodulated soybean. The N2-fixation estimates given
by 15N were correlated with C2H2
reduction activity but not with the differences in N yield. The results of these workers indicate that
it is justified to use the variations in the isotopic N composition caused by
the variety or species, level of fertilizer N, or the time when samples are
taken, to estimate the nitrogen fixed.
Fiedler et al. (1972),
reported that routine analysis of 15N in agricultural
samples is a problem facing many agricultural research stations because mass
spectrometers are often not available and the investigators must depend on the
services of other departments for the work.
Proksch (1969) reported that the Dumas method is acceptable for outline
analysis of 15N in plant material. When the enrichment is low, i.e., below 5%
atom excess, the systematic errors introduced by nonrandom pairing of N atoms
is negligible. The slightly higher 15N values found when
Dumas values are compared with Kjeldahl values are probably due to the more
complete conversion of NO3 in the sample with the Dumeis
procedure. Rennie et al. (1982), used
the 15N isotope dilution method with two Canadian soybean
cultivars and observed that N yield of inoculated cultivars was not affected by
increasing rates of N application. The
highest fertilizer use efficiency was 51% and 44% in uninoculated and
inoculated cultivars, respectively.
Both cultivars had similar percent N derived from the atmosphere (%
Ndfa) and amount of N fixed ha-1.
2.6. Nitrogen
Balance vs the 15N Isotope
Dilution Methods
Talbott et al. (1982), reported that
estimates from the difference method and 15N method for
the amount of total N2-fixed were highly correlated. The % N derived from fixation varied between
the two methods, and was attributed to spatial variation of available soil
nitrogen. Vasilas et al. (1984)
evaluated the N2-fixation measurement techniques and found that
estimates by the difference method exceeded those by isotope dilution by an
average of 5%, which was very small compared to the total variation. They also observed that the difference
method provided representative N2-fixation values where soil N
conditions permit proper development of non-nodulating control plants, but do
not depress N2-fixation. The
difference method and isotope dilution technique gave similar estimates at the
100 kg N rate with low soil N and at the 10 kg N rate with higher soil N. These findings indicate that over a wide
range of soil N regimes, the difference method gives as accurate a measure of N2-fixation
as the more expensive and complicated isotope methods. Rennie (1984) obtained different results
when he evaluated two techniques commonly used to estimate N2-fixation
over the growing season in field-grown legumes. The total nitrogen balance method (difference method) generally
gave a lower estimate of N2-fixation and was consistently less
precise (higher experimental error).
Good agreement between the two methods was found in 70% of the
experiments in which the amount of N2-fixed was estimated, but in
only 60% of the experiments in which the percentage N2-fixed was
estimated. He also indicated that
nitrogen balance method was most reliable in experiments where soil N was low,
so that non-fixing plants showed signs of N deficiency by anthesis. He concluded that the nitrogen balance
(difference method) cannot be used with confidence to estimate N2-fixation
in field-grown legumes.
Rennnie et al. (1984) used 15N
to determine N2-fixation in two cultivars of field beans
receiving two rates of fertilizer N. At
10 kg N ha-1, the amount fixed ranged between 114 and 124 kg ha-1. The cultivar that fixed more nitrogen was
observed to have a longer vegetative phase.
Thus, indicating that cultivars of field beans with longer vegetative
phases tend to fix more nitrogen. The
authors concluded that when field beans are properly inoculated, they obtain
more than 60% of their N from N2-fixation and good yields can be obtained
without the addition of fertilizer N.
In another experiment, Rennie end Dubetz (1984) used the 15N
isotope dilution method to quantify the amount of N fixed by soybean
cultivars inoculated either with single strain or multi strains of Rhizobium
japonicum. They found that several
strains gave the %Ndfa in excess of 50% and the fixed N2 as high as
151 kg N ha-1. They also
observed that cultivar by strain combinations resulted in lower levels of fixed
N2 and more soil N assimilated.
In another field experiment, Rennie and Kemp
(1983b) used the 15N isotope dilution method to quantify
nitrogen fixation by different cultivars.
The authors found that in some cultivars, the addition of 40 kg N ha-1
caused a 10% reduction in percent N derived from the atmosphere (%Ndfa). The amount of N fixed varied with the
cultivar but not with the rate of applied N.
Some cultivars were superior when evaluated at anthesis but not at
maturity, indicating a difference in the duration of the N2-fixation
of the cultivar. They observed a host-specific reaction to mineral N with
regard to the nitrogen fixation supportive trait (nis). This means that the effect of mineral N on
nitrogen fixation supportive gene varied between different cultivars. Climbing bean cultivars had a greater %Ndfa
and thus were superior in the nitrogen fixation supportive trait (nis) than
bush beans. They further indicated that
in the field, % Ndfa of beans was approximately 50%, with the other 50% being
derived from fertilizer and/or soil N.
The actual amounts of N2-fixed varied between 40 and 125 kg
ha-1, depending on the cultivar.
In a related study, Rennie and Kemp (1983a)
used the 15N isotope dilution method to quantify N2-fixation
in field beans inoculated with different strains of Rhizobium phaseoli. Their findings indicate that some strains
fixed more than 100 kg N ha-1, resulting in dry matter and N yield
in excess of those of control treatments.
They concluded that Rhizobium phaseoli are as efficient as
other rhizobia in supplying fixed N2 to their host plant in the
field without the addition of fertilizer N.
Witty (1983) indicated that field estimates of nitrogen fixation by any
method in field-grown legumes depended on the non-fixing control used.
These findings suggest that 15N
isotope dilution is a reliable method and can be used to quantify
nitrogen fixation by different cultivates of field-grown legumes or by
different Rhizobium strains. However,
conflicting results were obtained by various workers in comparisons of the
nitrogen balance (difference method) with the 15N isotope dilution method for estimating the % of N2
fixed in field experiments. This
indicates that more research needs to be done to ascertain differences or
similarities between the two methods in estimating nitrogen fixation by field
grown legumes.
2.7. Residual Nitrogen
Mughogho et al. (1982)
observed that yield of subsequent maize crops was increased by the
incorporation of cowpea residues that made available to the corn crop the
equivalent of 40-80 kg of fertilizer N ha-1. Eaglesham et al. (1982) observed that cowpea
cultivars increased soil nitrogen at low, but not at high, fertilizer
inputs. Soybeans fixed more nitrogen
than cowpeas, but produced greater nitrogen depletion, because of the greater
proportion of nitrogen removed with the seeds.
In another study, Eaglesham (1981), using the difference method
estimated the N2 fixed by four cowpea cultivars ranged from 49-101
kg N2-fixed ha-1 per cycle. With 25 kg ha-1
fertilizer nitrogen applied, there was a positive soil nitrogen balance of 2-52
kg N ha-1. Herridge
(1982) reported that a fully symbiotic crop will enrich the soil with nitrogen,
while the partly symbiotic crop may have no effect, and the non-symbiotic crop
will reduce soil N level. In the latter
case, a subsequent non-legume crop may require supplemental inorganic
nitrogen. Rao et al. (1981) reported
that legume rotation maintained higher levels of organic carbon and total
nitrogen than cereal rotation. It is
believed that some legumes excrete some of the nitrogen fixed into the soil
during the growth of the crop, but present evidence suggests that the amounts
released under field conditions are small.
The main residual effect of a legume will depend on the proportion of nitrogen retained in the
non-harvested residues and their rate of mineralization. Narwal et al. (1983) studied the effects of
preceeding grain legumes on the nitrogen requirement of wheat grown on sandy
Ram soils. Yields of wheat were significantly increased when grown after black
gram (110%), green gram (108%) and soybean (41%) compared to pigeon pea. Preceeding crops of green gram and black
gram reduced the nitrogen requirement of a succeeding wheat crop by 30-60 kg N
ha-1 compared with a reduction of 30 kg ha-1 after pigeon
pea or soybean. Pigeon pea was the
least beneficial, but a pigeon pea/wheat cropping sequence produced maximum
benefit. Nambier et al. (1981) reported
that intercropping peanut with cereal resulted in reduced nodulation and N2-fixation. When grain millet was planted in rotation
with peanut or maize supplied with 20 kg N ha-1, yields following
peanut were 524 kg ha-1 greater than those obtained in the
millet/maize rotation. He further
reported that one of the earliest recognized advantages of a legume crop was
the residual N contributed to a subsequent crop.
The results of these workers indicate that
yields of cereals following legumes increased but the increase depended on the
proportion of nitrogen retained in the non-harvest residues and their rate of mineralization.
III.
FIELD ESTIMATES OF NITROGEN FIXATION
Information regarding
nitrogen fixation by field-grown legumes is beneficial to cropping systems
which depend on biological nitrogen fixation (BNF) for crop production.
3.1. Materials and Methods
3.1.1. Location and Soils
Two field experiments
were conducted in Kuiaha, Maui, in Hawaii located 200 54' N and 1560
17' W, 320 meters above sea level with annual rainfall of 2110 mm, most of
which falls between November and April.
The soil in the area is the Haiku clay series (clayey, ferritic,
isothermic Humoxic Tropohumult). The
mean annual soil temperature is 700 F.
3.1.2. Land Use
The primary use of the
Haiku clay is pineapple production with residential and pasture as secondary
uses. The land has the following
natural vegetation: Cassia leschenaultiuna, Lantana species,
Guava (Psidium guajara), Grasses (Brachiaria mutica,
Paspalum conjugatum, Paspalum arbiculare), and
Legumes (Desmodium triflorum, Indigofera suffruticosa,
and Mimosa pudica).
3.1.3.
Experimental Design
The experiment was
arranged in a randomized complete block design (RCBD) with nine treatments
replicated four times. Plots consisted
of four legume species soybean (Glycine max) var. Jupiter, peanut
(Arachis hypogaea) var. Burpee Starr, cowpea (Vigna unguiculata)
var. Knuckle Purple Hull and Bushbean Phaseolus vulgaris) var. Texas
Wonder which were either inoculated or remained uninoculated. In addition
corn was grown as another non-fixing reference crop. These legume species will
be collectively referred to as "N fixing legumes". The uninoculated
bushbean and soybean together with sweet corn (U.H # 9) were the reference
controls. These will be referred to as
"reference crops."
3.1.4. Treatments
The treatments were
as follows:
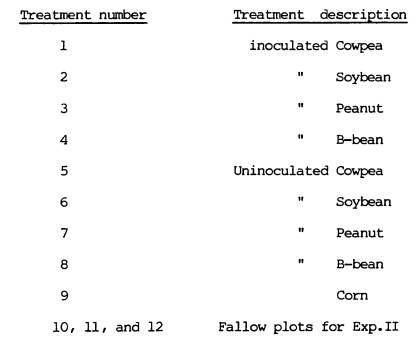
3.1.5.
Inoculation and Planting
The seeds for each cultivar were inoculated
immediately before planting with appropriate peat-based Rhizobium
strains obtained from the NIFTAL Rhizobium Collection. The strains were: TAL 1000, TAL 169, TAL
182, and TAL 102 for peanut, cowpea, bushbean, and soybean respectively. Seeds for each plot were treated with 3 ml
gum arabic solution (40g L-l H20) then a peat based
inoculant applied to the seeds at the rate of 10 g per 100 g seed, and then
pelleted with 6 g of calcium carbonate.
Seeds were planted in four rows 5 m long and 65 cm apart. The spacing resulted in plant population of
3x10⁵, 1.05x10⁵, 1.5x10⁵, 1x10⁵,
and 0.8x10⁵ plants ha-1 for soybean, peanut, cowpea,
bushbean, and corn respectively.
Uninoculated plots were planted first in order to avoid cross
contamination between plots. Subsequent
field operations such as weeding were cautiously done to avoid transfer of
rhizobia from inoculated plots to uninoculated plots. Plants were thinned to one plant per hill 12 days after
germination. Lasso, a premergence
herbicide was applied at a rate of 9 ml m-2 at the time of
planting. Thiodan, a foliar
insecticide, was applied at a rate of 3 g m-2 3 days after
emergence. Plots were subsequently
sprayed with appropriate chemicals to control insects. Cowpea plots were replanted 7 days after
emergence because of the damage by chemicals.
3.1.6. Fertilizer and 15N
Application
All plots received a blanket fertilizer
application of potassium as K2SO4, phosphorus as triple
super phosphate, magnesium as MgSO4·7H20, zinc as ZnSO4,
molybdenum as Na2MO3·H20 and boron as H2BO3
at rates of 250, 400, 67, 15, 1 and 5 kg ha-1, respectively. Lime was applied at ten Mg ha-l as
CaCO3 and dolomite in a ratio of 60:40 three weeks before planting. A solution of 15N-labelled (NH4)2SO4,
about 4 atom % 15N, was prepared by dissolving 17.401 g of
enriched material and 363.53 g of ordinary (NH4)2SO4
which were equivalent to 10 kg N ha-1, in 40 liters
of deionized water. The solution was
then made up to 80 liters by adding more deionized water. Two liters were sprayed on the 15N
microplot (see Fig.24 Appendix VI) which was 2.6 m2 of 15
N. The remmiinder of the plots
received the equivalent of 10 kg N ha-l as ordinary ammonium
sulfate. All plots were
sprinkler-irrigated soon after planting.
Subsequent moisture supply was maintained at 0.1 bar with the aid of
tensiometers.
3.1.7. Determination of Indigenous
Rhizobia in Kuiaha Soil
Soil samples were taken from the uninoculated
plots 11 days after planting. Samples
were composited and a subsample of 50 g of dry soil was taken and mixed with
450 ml of sterile water and shaken vigorously for 10 minutes. A series of dilutions ranging from 10-1
to 10-6 were made by adding 1 ml of suspension into 9 ml sterile
water and repeated 5 times. About 100
seeds of each species were surface sterilized and pregerminated in sterile
vermiculite. Well germinated seeds of similar size and radical length were
selected and transferred aseptically to growth pouches. Seedlings in growth pouches received 30-40
ml of B&D plant nutrient solution.
There were 30 pouches to count dilution, for 10-1 to 10-6
in quadruplicate plus one control pouch following each group of four. Plants were inoculated by pipetting 1 ml of
each dilution (from 10-1 to 10-6) to each one of the four
replicate in each set starting from the highest dilution and proceeding down
the series with the same pipette. For
every species, the number of nodules for each dilution were recorded and the
most probable number (MPN) determined 21 days after inoculation.
3.1.8. Sampling and Nitrogen Determination
Plant samples for fresh and dry weight were
taken at 30, 60, and 80 days after emergence (DAE) from sample rows of the main
plots. Samples for 15N were
also taken at the same time from the 15N subplots. Samples for nodule count, nodule dry weight,
and plant dry matter yield were taken at 30 DAE, from border rows of N2-fixing
cultivars. All plants sampled were
composited for total N analysis. No
attempts were made to collect abscised leaves and petioles. N2 fixation estimates for all
sampling dates were based on the total above ground plant parts. Plant samples were oven dried to a constant
weight at 700 C, ground to pass a 1-mm screen, and then subsampled
for N analysis.
Total N was determined on all shoots by
digesting 250 mg of oven dried samples (700 c) in 7 ml of
concentrated sulfuric/salicylic acid mixture with sodium sulfate and selenium
as a salt/catalyst mixture added, to raise the boiling temperature of the
digestion mixture. Alkaline phenol was
used for color detection. The analysis was done by the Agricultural Diagnostic
Services Center, Agronomy and Soil Science Department, University of Hawaii.
For 15N determination,
100 mg of plant samples were mixed in a digestion tube with 3 ml of salicylic
acid in concentrated sulfuric acid with 5g of sodium thiosulfate and allowed to
react overnight. Hydrogen peroxide (5
ml) and 10 g of a salt mixture consisting of K2SO4, CuSO4,
and metallic selenium were added to the digestion tubes and the mixture heated
for 3 hours in a digestion block. The
temperature was increased gradually from 150 to 350 C. The clear digest was
mixed with 20 ml of 13N NaOH, steam-distilled, and the ammonia collected in 15
ml of 0.02N H2SO4.
The distilling apparatus was cleaned between samples by distilling 20 ml
of ethanol through it. The collected
distillate was evaporated to 1 ml for 15N determination
at the Las Alamos Scientific
laboratory. Calculation for atom % 15N
excess was based on the natural abundance of 0.369 atom % 15N for
Kuiaha Soils. The atom % excess refers
to the difference between the relative amounts of 14N and
15N in a given material and that of the natural
abundance. The natural abundance refers
to the relative amounts of 14N and 15N of
samples in nature. Both the amount and
percent N fixed for each cultivar were determined using the total nitrogen
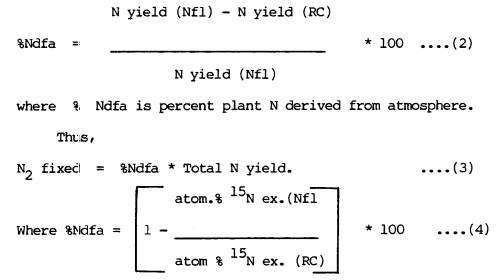
difference method and 15N isotope dilution method. The difference method was based on the
difference in total N between the N2-fixing legume (Nfl) and the
reference crop (RC). Thus,
N2 fixed = N yield (Nfl) - N yield
(RC) ..(1)
3.1.9.
Statistical Analysis
Analyses of variance
for the atom % 15N excess in reference crops, the effect
of reference crops and harvest date on nitrogen fixation estimates, and
inoculation response were carried out for each cultivar at all harvest dates.
Regression analysis of the relationship between the estimates of fixed N by the
two methods was carried out for all N fixing legumes at each harvest date.
3.2. Results and Discussions
3.2.1.
Inoculation Response
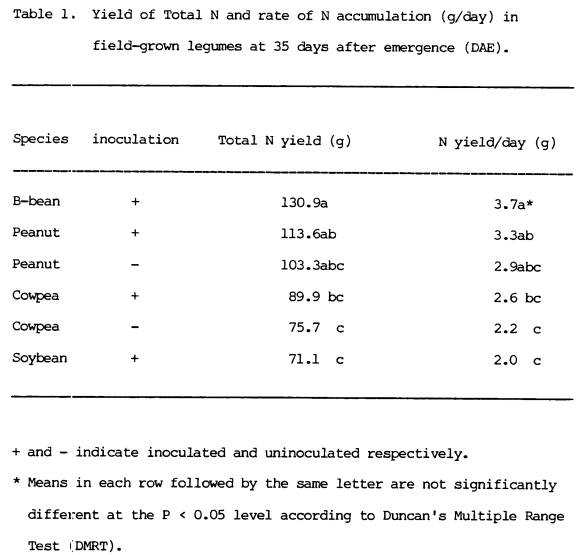
Total N yield (Figure 1)
in field-grown legumes indicate that there were no differences between the
inoculated and uninoculated species at 30 days after emergence (DAE). At 60 DAE, soybean had significantly higher
total N with inoculation than without inoculation. Bushbean did not respond to field inoculation at 30 and 60 DAE,
although uninoculated soybean and bushbean remained nonnodulated. Uninoculated
peanut and cowpea were nodulated by native rhizobia. Most probable number (MPN) studies using plant infection
indicated that there were 1.0 x 10⁴ and 1.0 x 10² cowpea
and peanut rhizobia g-1 of Kuiaha soil, respectively (Tables 12 and
13, Appendix II). At 80 DAE, only soybean
responded significantly to inoculation.
It appears therefore, that the soil had a sufficiently high level of N
to depress the inoculation response of a short-term crop like bushbean, but not
that of a long-term crop such as soybean.
This is substantiated by the total nitrogen yield of corn (106.4 kg N ha-1)
at 60 days after emergence.
3.2.2
Early Yield and Nodulation
indices
Indices of nodulation
(nodule number, fresh or dry weight) can be used as an indirect method for
estimating N2-fixation in field-grown legumes. Larue et al. (1981) reported that within one
cultivar, nodulation indices may be closely related to nitrogen fixation. In this experiment, the parameters used to
evaluate the relationship between nodulation indices and N2-fixation
35 DAE were: (1) plant dry weight vs. nodule dry weight and (2) percent shoot N
vs. nodule dry weight. Regression
analysis for total N yield against nodule dry weight indicated a highly
significant negative correlation (r=-0.99** and r=-0.96**) for inoculated soybean
and uninoculated cowpea, respectively, probably due to high soil
heterogeneity. There was no significant
relationship between plant shoot N and nodule dry weight for most species. When analysis of variance was carried out
for total N yield, inoculated bushbean was not significantly different from
inoculated and uninoculated peanut.
Inoculated and uninoculated peanut, and inoculated cowpea were not
significantly
|
|
different from each
other, but were significantly different from uninoculated cowpea and inoculated
soybean (Table 1).
These results suggest
that at 35 days after emergence, N
accumulation by inoculated bushbean was the
highest though not significantly different from that of inoculated and
uninoculated peanut. More information
could have been obtained if data on nodulation indices had also been collected
at 60 and 80 days after emergence.
3.2.3.
Evaluation of Reference
Crops
Reference crops or
non-fixing control plants are essential when using the 15N isotope
dilution method to estimate the nitrogen derived from fixation (Ndfa). The control plants are also used to
determine the contribution of soil nitrogen and/or fertilizer N to the N yield
of the fixing plant (Fp). Although
there are several possible non-fixing controls, theoretically, the best control
is the fixing system itself in non-fixing mode (Rennie et al., 1984). Thus, in
soils where no indigenous rhizobia exist,
the uninoculated nodulating cultivar would be an excellent control. In case where indigenous rhizobia exist, and
a number of species are being tested, Rennie (1984) reported that a non-legume
such as corn can be used. Under such
conditions however, the non-fixing control must assimilate its N from the soil
and fertilizer N pool so that maximum N uptake is reached at about the same
time after emergence as the fixing plant.
This means they should have identical 15N:14N
ratios, but total N does not have to be identical to the legume species
(Rennie and Kemp, 1984). The authors also reported that it is crucial that both
the fixing and non-fixing controls have similar rooting patterns.
3.2.3.1 Total N Uptake
In this experiment,
the pattern of soil and fertilizer N uptake by corn was not similar to that of
soybean or bushbean (Figure 2). The
lack of similarity between the reference crops was attributed to differences in
rooting patterns and rates of maturity among the species, hence the
|
|
differences in N uptake profiles.
3.2.3.2. Atom %
15N Excess
Analysis of variance for the atom % 15N
excess in reference crops indicated that there were no significant
differences between the reference crops at 30, 60, and 80 DAE. The coefficient of variation for the atom % 15N
excess in soybean, bushbean, and corn was 75.8 % at 30 DAE and 83.7% at
60 DAE. At 80 DAE, the C.V for the atom
% 15N excess in soybean and corn was 90.4%. The high C.V for the atom % 15N
excess in reference crops was probably due to non-uniform application of 15N
solution, soil heterogenity, or the number of plants per sample. The number of plants sampled depended on the
number of plants Fer linear meter. Soybean for instance, had more plants per
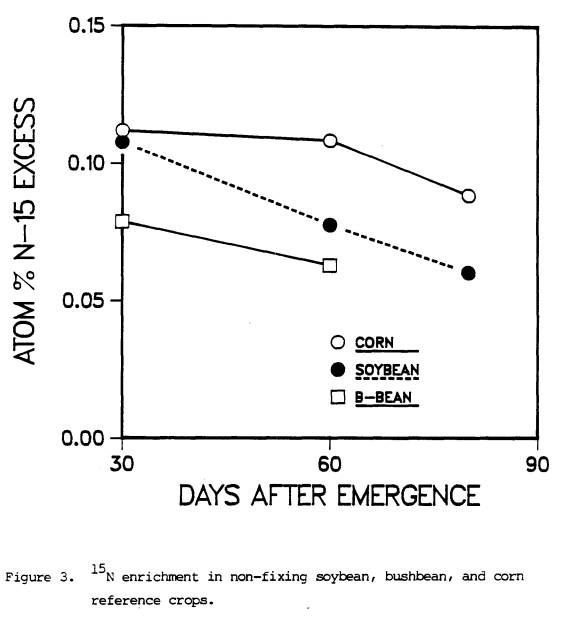
meter than corn. However, at 30 DAE,
the linear dilution of the isotope ratios for soybean and bushbean as opposed
to a non-linear dilution for corn was observed in a plot of atom % 15N
excess against time for reference crops (Figure 3). The dilution of the isotope ratios in
inoculated soybean and both inoculated and uninoculated peanut were also linear
(Fig.4). On the other hand, the
dilutions of isotope ratios in both inoculated and uninoculated cowpea were not
linear, but more similar to that of soybean than that of corn.
The similarity in N
uptake and the pattern in the dilution of the isotope ratios in both
uninoculated and inoculated soybean together with inoculated and uninoculated
peanut meant that these crops were sampling N pools of identical 15N:14N
ratios. The dilution of the isotope
ratios in the fixing peanut and soybean was due to an N source of significantly
lower 15N content, namely the atmosphere, and was
attributed to N2-fixation.
The inoculated and uninoculated peanut together with inoculated and
uninoculated soybean had similar N uptake patterns and were still growing at 80
DAE (Figure 5). The dilution of the
isotope ratios of both inoculated and uninoculated cowpea were also more
similar to that of soybean than corn while the total N uptake pattern in
inoculated cowpea. Both crops matured
at the same time and lost N between 60 and 80 days after emergence.
Since bushbean was
mature at 60 DAE, it could not be used as a reference crop
|
|
|
|
|
|
|
|
crop for any fixing species other than fixing
bushbean. These findings suggest that
uninoculated soybean is a good reference crop for estimating N fixation in
soybean and peanut. Corn is a good reference
crop for estimating N fixation in inoculated cowpea, since the two species had
similar N uptake profiles and reached maximum N content at the same time. This is in contrast to the dilution of the
isotope ratios.
3.2.3.3. 15N
Dilution Method
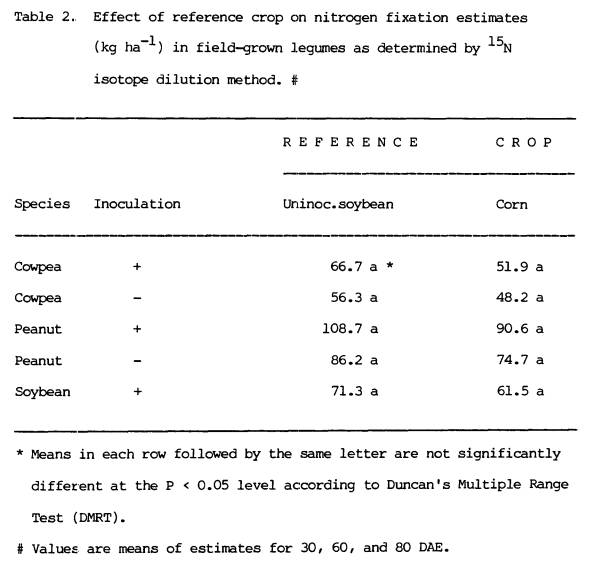
The effect of reference crops on N2-fixation
estimates in field-grown legumes using the 15N isotope
dilution method is shown in Table 2. Consistently higher estimates of fixation
were obtained with soybean than with corn in all legumes, but the differences
in estimates were not significant. It
should be borne in mind that where N fixation estimates were negative, a
minimum value of 0.1 was included for statistical analysis.
In order to compare bushbean (which matured
in 60 days) with other reference crops, it was necessary to compare all
reference crops with the mean values for 30 and 60 days after emergence (Table
3). No significant differences were
found between the reference crops.
However, soybean again gave the highest estimates followed by bushbean
while corn gave the lowest estimates for all species. Although there were no significant differences between the
reference crops for the N fixation estimates, the low estimates given by corn
confirm that N assimilation by corn at 30 and 60 DAE, was different from that
of soybean and bushbean.
3.2.3.4
Harvest Date
by Reference Crop Interaction by
the 15N Method
The use of soybean as a reference crop
yielded consistently higher estimates of N fixed in inoculated cowpea than the
use of corn at all harvest dates (Figure 6).
Cowpea appeared to lose N at 80 days after emergence according to the
estimates obtained by using soybean as a reference crop, but gained N when corn
was used as a reference crop.
Since
|
|
|
|
both inoculated cowpea and corn were
physiologically mature at the final harvest and soybean was still accumulating
nitrogen, it is possible that estimates made using soybean at 80 days after
emergence, may have been due to the differential N uptake by soybean and
cowpea. Nevertheless, these estimates
suggest that inoculated cowpea lost more than 10 kg N ha-1. In the case of uninoculated cowpea, there
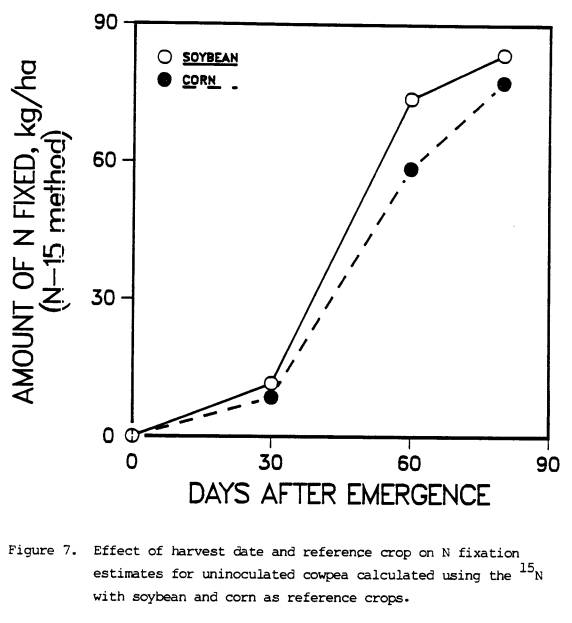
was no significant harvest date by reference crop interaction (Figure 7). However, the use of soybean as a reference
crop gave consistently higher estimates than the use of corn. Similarly, there
was no significant harvest date by reference crop interaction for N2-fixation
estimates in both inoculated and uninoculated peanut and in inoculated soybean
(Figures 8, 9, and 10 respectively).
These results indicate that when 15N
isotope dilution method was used to estimate N fixed in field-grown
legumes, the use of soybean as a reference crop resulted in non-significant
higher estimates than when corn was used as a reference crop.
3.2.3.5. Difference
Method
With the difference
method, the use of soybean as a reference crop yielded significantly higher
estimates of nitrogen fixed in uninoculated cowpea than when corn was used
(Table 4). There were no significant
differences between the estimates of N fixation in the other species using
soybean and corn. When the nitrogen
fixation estimates, obtained using all three reference crops, were averaged
over the 30 and 60 days and compared (Table 5), the use of soybean as a reference
crop gave significantly higher estimates in all species than the use of corn as
a reference crop. The use of soybean as
a reference crop gave significantly higher estimates in inoculated bushbean
than when bushbean was used as a reference crop. Estimates obtained when bushbean was used as a reference crop
were significantly different from the estimates obtained when corn was used in
most species except inoculated soybean and bushbean. The use of soybean as a reference crop resulted in higher estimates
for all species
|
|
|
|
|
|
|
|
|
|
followed by bushbean,
while the use of corn always gave the lowest estimates. These results indicate
that at 30 and 60 days after emergence, the estimates obtained when soybean and
corn were used as reference crops, were significantly different in all species.
Averaged over 30, 60, and 80 days after
emergence however, the estimates obtained using soybean and corn as reference
crops were significantly different in uninoculated cowpea.
3.2.3.6.
Harvest Date by Reference Crop Interaction
by the Difference Method
When the difference
method was used to estimate the amount of N fixed in various legumes with
soybean and corn as reference crops,
significant harvest date by reference crop interactions were observed. For inoculated cowpea, there was a
significant interaction between harvest date and reference crop (Fig.ll). At 60 DAE, the use of soybean as a reference
gave significantly higher estimates in inoculated cowpea than the use of
corn. At 30 days after emergence, the
use of soybean as a reference crop gave non-significant higher estimates than
the use of corn. Estimates obtained
using corn as a reference crop at 80 DAE were higher than those with soybean
but were not significantly different.
In the case of uninoculated cowpea, a highly significant harvest date by
reference crop interaction (P < 0.01) was observed (Fig.12). The use of soybean as a reference crop gave
significantly higher estimates than the use of corn at 60 days after emergence. The estimates at 30 and 80 DAE using soybean
as a reference crop were non-significantly higher than the use of corn. Significant differences between estimates
using soybean and corn as reference crops at 60 DAE were attributed to large
differences in N uptake between cowpea and corn at 60 days after
emergence. There was no significant
harvest date by reference crop interaction for inoculated peanut (P <
.09). However, the use of soybean as a
reference crop gave a significantly higher estimate than the use of corn at 60
DAE. At 80 DAE, the use of corn gave a
non-significantly higher estimate than the use of soybean (Fig.13). The
|
|
|
|
higher estimate obtained with corn as a
reference crop at 80 DAE may have been due to the differential N uptake by corn
and peanut since peanut was still accumulating N while corn was mature. Moreover, the total N yield by corn at 80
DAE was lower than at 60 DAE, suggesting that corn must have lost N between 60 and 80 DAE. Such a loss of total N by corn explains why
N fixation in inoculated peanut may have been overestimated. For uninoculated peanut, the use of soybean
as a reference crop gave significantly higher estimates than the use of corn as
a reference crop at 60 DAE (Figure 14).
At 30 and 80 DAE, the estimates using both soybean and corn as reference
crops were not significantly different although the use of soybean as a
reference crop gave higher estimate than they use of corn. There was no significant harvest date by
reference crop interaction for the N2-fixation estimates in
inoculated soybean (Figure 15). However, the use of soybean as a reference crop
gave consistently higher estimates than the use of corn at all dates. At 80 DAE, estimates by corn and soybean
were close probably because corn lost N at 80 DAE and the amount of N fixed by
inoculated soybean may have been overestimated.
These results indicate that on the average, the N fixation
estimates obtained by using soybean as a reference crop were higher than those
obtained when bushbean and corn were used as reference crops. The N uptake pattern for the soybean
reference crop was similar to that of inoculated peanut, uninoculated peanut,
and inoculated soybean. The N uptake
pattern of corn was similar to that of the inoculated cowpea, but different
from those of other legumes. The
harvest elate by reference crop interactions which were observed with the
difference method might have been caused by the large differences in N uptake
pattern between corn and the legumes.
The results are also in agreement with those of Witty (1983), who found
that the ideal legume-control combination should have similar rooting patterns
and similar N uptake profiles, specifically the same crop growth constant and
the same time to half maximum N content.
|
|
|
|
|
|
|
|
|
|
3.2.4. Nitrogen Fixation Estimates
by the 15N Method
The two parameters evaluated in the N2-fixation
estimates by the 15N method were harvest date and the
reference crops. As displayed in table
6, inoculated cowpea attained maximum N content between 60 and 80 days after
emergence (DAE). There were no
significant differences between the estimates at 60 and 80 DAE. However, estimates at 30 days were
significantly different from estimates at 60 and 80 DAE. Nitrogen fixation estimates in uninoculated
cowpea at 60 and 80 DAE were not significantly different. Maximum N content in uninoculated cowpea was
at 80 DAE. However, estimates at 30 DAE
were significantly different from estimates at 60 and 80 DAE. While N fixation estimates in inoculated
cowpea showed a decline at 80 DAE, N fixation estimates in uninoculated cowpea
showed an increase. It appears from
these results that the N fixation period in inoculated cowpea was shorter than
that in uninoculated cowpea probably due to different rhizobia strains. N2-fixation estimates in
inoculated peanut at 80 DAE were significantly different from estimates at 30
and 60 DAE which were also significantly different from each other. Similarly, N fixation estimates in
uninoculated peanut at 80 DAE were significantly different from estimates at 60
and 30 DAE which also were significantly different from each other. Although the N fixation estimates in
inoculated peanut were not significantly different from the estimates in
uninoculated peanut at each harvest date, the estimates in inoculated peanut
were higher than those in uninoculated peanut at 60 and 80 DAE. N fixation estimates in inoculated soybean
at 80 DAE were significantly different from estimates at 60 and 30 DAE which
were also significantly different from each other. In the case of bushbean, N fixation estimates at 30 and 60 DAE
were not significantly different.
These results indicate that N fixation
estimates in inoculated peanut, uninoculated peanut and inoculated soybean
followed the same pattern,
|
|
increasing from lowest at 30 DAE to highest
at 80 DAE. This is probably because
peanut and soybean were long-duration crops compared to bushbean and cowpea
which were short-duration crops. Within
species however, only cowpea attained maximum nitrogen fixation at different
harvest dates probably as a result of inoculation with exotic or native
rhizobium strains in the inoculated and uninoculated cowpea, respectively.
3.2.5. N2-Fixation Estimates by
the Difference Method
The difference method has been reported to be
less accurate than the 15N isotope dilution method by
many workers (Rennie et al. 1984., Patterson 1982., Vasilas et al. 1984). The N fixation estimates calculated using
the difference method were based on the total N balance between a N2
fixing (F1) and a non-fixing system (nFs).
Thus,
N2-fixed = N yield (Nfl) - N yield
(RC). .....(1)
The effect of harvest date on the mean of
nitrogen fixation estimates using soybean, bushbean and corn as reference crops
in field-grown legumes calculated using the difference method is given in
Table 7. N fixation estimates in
inoculated cowpea at 30 DAE were significantly different from the estimates at
60 and 80 DAE which were significantly different from each other. Maximum N
fixation in inoculated cowpea occurred between 60 and 80 DAE. At 80 DAE, N
fixation estimates in inoculated cowpea were less than the estimates at 60 DAE,
indicating that inoculated cowpea lost N. N fixation estimates in uninoculated
cowpea at 30 DAE were significantly different from estimates at 60 and 80 DAE
which were not significantly different from each other. At 80 DAE, N fixation estimates in
uninoculated cowpea were still increasing.
N fixation estimates at 30 DAE in inoculated and uninoculated peanut
were significantly different from estimates at 60 and 80 DAE which were
significantly different from each other.
N fixation estimates at 80 DAE in both inoculated and uninoculated
peanut were still increasing.
Similarly, N fixation estimates at 30 DAE in inoculated soybean were
significantly different from estimates at 60
|
|
and 80 DAE which were significantly different
from each other. At 30 and 60 DAE, N
fixation estimates in inoculated bushbean were not significantly different.
These results indicate that N fixation
estimates in a short-duration crop such as bushbean were not significantly
different at 30 and 60 DAE. For an
intermediate-duration crop such as cowpea, N fixation estimates at 30 DAE were
significantly different from estimates at 60 and 80 DAE which were in turn not
significantly different from each other.
In long-duration crops such as peanut and soybean, N fixation estimates
at 30, 60, and 80 DAE were significantly different from each other.
3.2.6. Comparison of the Methods
The parameter which was used in the
evaluation of the two methods was the amount of nitrogen fixed by all the
inoculated legumes at three harvest dates using the three reference crops. The relationship of the estimates for the
amount of nitrogen fixed at 30 days after emergence using soybean as a
reference crop is displayed in figure 16.
The correlation between the difference and the 15N isotope
dilution methods was very low (r=0.15).
When bushbean was used as a reference crop, the correlation was also low
(r=0.38) as displayed in figure 17.
When corn was used as a reference crop, the relationship between the
estimates by the difference and 15N methods was negative
(r=-17) as is shown in figure 18.
These results indicate that there was no
agreement between the two methods using soybean, bushbean, and corn reference
crops at 30 DAE. At 60 days after
emergence however, the correlation (r=0.82**) for the relationship of the
estimates by the difference and the 15N isotope dilution
methods using soybean as a reference crop was high and significant (Figure
19). Similarly, the correlation
(r=0.77**) for the relationship between the estimates by the difference and the
15N isotope dilution methods using bushbean was high and significant
(Figure 20). When corn was used as a
reference crop, the
|
|
|
|
|
|
|
|
|
|
|
|
correlation (r=0.11) for the relationship
between the difference and the 15N isotope dilution
methods was very low (Figure 21). At 80
DAE, the correlations (r=0.91** and r=0.69**) for the relationship between the
estimates by the difference and the 15N isotope dilution
methods using soybean and corn, respectively, were high (Figures 22 and 23). At 30
DAE, the coefficients of variation of the estimates by the difference method
using soybean, bushbean, and corn were 110.3, 141.7, and 234.9 respectively
(Table 8). At 60 DAE, the coefficients
of variation (31.7, 43.1, and 111.7) of the estimates by the difference method
using soybean, bushbean, and corn as a reference crop respectively were lower
than those obtained at 30 DAE. However,
the coefficient of variation of the estimates by the difference method using
corn as a reference crop at 60 DAE, was still very high compared to those
obtained when soybean and bushbean were used as reference crops. At 80 DAE, bushbean was already mature and
the coefficients of variation (28.3 and 49.8) of the estimates by the
difference method using soybean and corn respectively were lower than those
obtained at 60 DAE. The lowest
coefficient of variation (28.3) of the estimates by the difference method was
obtained when soybean was used as a reference crop at 80 DAE. This explains why the best agreement
(r=0.91**) between the estimates by the difference and the 15N
isotope dilution methods was obtained at 80 DAE using soybean as a reference
crop.
These results indicate
that agreement between the estimates by the difference and 15N isotope
dilution methods was possible depending on (1) the time of harvest, (2) the
type of reference crop used, and (3) the coefficient of variation of the
estimates by the difference method.
Thus, at 30 DAE, there was no agreement between the estimates by the
difference and the 15N isotope dilution methods. At 60 DAE however, there was agreement
between the two methods when soybean and bushbean were used as reference crops,
but not when corn was used as a reference crop. At 80 DAE, the best agreement between the estimates by the
difference and the 15N isotope dilution methods was obtained with
soybean as the
|
|
|
|
|
|
reference crop rather than corn. There was agreement between the estimates by
the two methods whenever the coefficients of variation of the estimates by the
difference method were less than 100%.
These results are in agreement with those of
Talbott et al. (1982). They found close
agreement between the 15N and the difference methods with
correlations ranging from r=0.89 to r=0.92 in two sets of experiments. The authors however, found poor agreement
between the two methods (r=0.38) when the percent of total nitrogen fixed
(%Ndfa) was used as the parameter for the evaluation. Rennie (1984), working with phaseolus cultivars also obtained
good agreement between the 15N and difference methods
most of the time when the soil N values were low with only isolated instances
of good agreement when soil N values were high. Vasilas et al., (1984) also found excellent agreement between N
fixation estimates of the 15N and the difference methods
estimates when soil N conditions permitted proper development of the control
plants, but did not depress N2 fixation.
IV. RESIDUAL NITROGEN
As most of the tropical soils are limited in
their ability to sustain continuous crop production due to low nitrogen, and
the cost of inorganic fertilizer nitrogen increased, biological nitrogen
fixation became the only alternative cheap source of nitrogen for crop
production. Information on the residual
N contribution to the cropping system by cowpea, peanut, soybean, and bushbean
can be used by farmers to improve their crop production practices.
4.1. Materials
and Methods
4.1.1. Land Preparation
The
experiment was planted approximately one year after the first experiment. Sweet corn (U.H # 9) cv. "Super sweet"
was grown on plots that had either been left fallow, grown cowpea, peanut,
soybean, and bushbean inoculated or uninoculated, or sweet corn in the
previously described experiment. Weeds
were kept to a minimum after harvesting the first experiment. A rotovator was used to plow the plots
before planting.
4.1.2. Experimental Design
The experiment had been installed in a
randomized complete block design with 12 treatments replicated four times in
the first experiment. Plots consisted
of 4 rows 5 meters long and 65 cm apart.
4.1.3. Treatment Design
The treatments were as described in
Experiment I plus three plots which had been left fallow. Urea was applied to all fallow plots at 0,
50, and 100 kg N ha-l; these amendments represent
treatments 10, 11, and 12, respectively as shown in figure 24.
4.1.4. Planting and Management
Sweet corn (U.H # 9) cv. "Super
sweet" was planted in all plots at 20 cm between hills and 65 cm between
rows, giving a plant population of approximately 76,000 plants ha-1.
Rows in each plot were run
approximately along the rows of the previous experiment with equal width. Furadan was
|
|
applied at the time of planting at a rate of
3 g/linear meter in furrow rows together with seeds to control stemborers. Drip irrigation lines were laid along the
corn rows and plots were irrigated to field capacity every time the top two
inches of the soil were dry. Nitrogen
in the form of Urea was applied to the fallow plots at 0, 50, and 100 kg N ha-1
in two doses, 1/3 at planting and 2/3 at 40 days after planting.
4.1.5. Harvest and Data Collection
Plant samples for fresh and dry weight were
harvested from three meters of the inner rows of each plot 50 days after
planting. Subsamples were taken, fresh
weight recorded, then subsamples were ovendried at 700, and dry
weight recorded. Samples were then
ground to pass a 1 mm screen, and subsampled for N analysis. Total shoot N was determined on above-ground
plant parts. Nitrogen was determined by
the Agricultural Diagnostic Services Center, Agronomy and Soil Science
Department, University of Hawaii.
Analysis of variance and the Waller test were used to compare treatment
means of total N yield.
4.2. Results
and Discussion
4.2.1. N Yield
Fallow + 100 kg N ha-l (12) gave
the highest N yield and was significantly different from other treatments
(Table 11). Inoculated cowpea (1) gave the second highest N yield followed by
Fallow + 50 kg N ha-1 (l1) but the two treatments were not
significantly different from each other, and were not significantly different
from the corn (9), uninoculated soybean (6), inoculated soybean (2),
uninoculated cowpea (5), and Fallow + 0 kg N ha -1 (10). They were, however, significantly different
from plots which grew inoculated bushbean (4), inoculated peanut (3),
uninoculated bushbean (8), and uninoculated peanut (7). Since most of the N contributed by the corn
plot (9) came from mineralized soil nitrogen, and these contributed more N than
the Fallow + 0 kg 14 ha-1 (10), it appears that
mineralization of soil N in plots that previously grew corn was higher than in
fallow plots. However, total N yield by
corn in Experiment I at 60 days after emergence was 106.4 kq N ha-1
while total N yield of corn at 50 days after emergence was 59.15 kg N ha-1
in Experiment II. It is not clear
whether the N that was lost by both corn and inoculated cowpea in Experiment I
was responsible for the relatively high residual N contribution to the
subsequent crop in Experiment II. These
findings emphasize the difficulties involved in quantifying the residual
nitrogen from the BNF to the cropping systems.
|
|
V. CONCLUSIONS
The major conclusions drawn from a field
experiment to evaluate the measurement of nitrogen fixation by field-grown
legumes are given below.
1.
Soil N was sufficiently high that it suppressed the inoculation response
of bushbean, an early maturing legume, but not of soybean, a late maturing
legume, indicating that soil N level affects the inoculation response by field-grown
legumes with varying rhizobial requirements.
2.
There was no relationship between nodulation indices and dry matter
yield at 35 days after emergence.
3.
There was no significant difference in 15N uptake
between the reference crops, soybean, bushbean and corn.
4.
There were no significant differences between N fixation estimates using
soybean and corn as reference crops with the 15N isotope
dilution method.
5.
Nitrogen fixation estimates using soybean as the reference crop were
significantly higher than the estimates using corn as the reference crop by the
difference method for inoculated cowpea, uninoculated cowpea, and uninoculated
peanut. However, N fixation estimates
using soybean as a reference crop were not significantly different from the estimates
using corn as a reference crop for inoculated peanut and soybean.
6.
The use of bushbean as a reference crop was only suitable for inoculated
bushbean since it matured before the other species.
7.
There was no agreement between the 15N isotope dilution
and the difference methods in the estimates of the amount of N fixed at 30 days
after emergence with any of the three reference crops.
8.
There was agreement between the estimates by the 15N and
the difference method at 60 days after emergence using soybean and bushbean as
reference crops, and at 80 days using soybean and corn as reference crops.
9.
The best agreement between the two methods was obtained at 80 DAE using
soybean as a reference crop.
10.
The coefficient of variation for the N fixation estimates by the
difference method was lowest with soybean and highest with corn as reference
crops at all three harvest dates.
11.
It is difficult to estimate residual N contributed by field-grown
legumes without measuring the portion of the soil N that was mineralized during
the period between the legume and the subsequent crop.
APPENDICES
Appendix I
|
|
Appendix II
|
|
|
|
|
|
|
|
Appendix III
|
|
Appendix IV
|
|
|
|
|
|
Appendix V
|
|
|
|
|
|
|
|
|
|
|
|
|
|
|
|
|
|
Appendix VI
|
|
BIBLIOGRAGHY
Amarger, N., F. Mariotti, J. C. Durr, C.
Bouguigno, and B. Lagacherie. 1979.
Estimates of N2-fixation by field-grown soybeans using
variations in 15N natural abundance. Plant and Soil 52:269-280.
Bhangos, M. S. and D. J. Albritton. 1976.
Nodulating and non-nodulating Lee soybean isoline response to applied
nitrogen. Agron. J. 68:642-645.
Dobereiner, J. and A. B. Campelo. 1977.
Importance of legumes and their contribution to tropical
agriculture. p. 191-220 In
Hardy, R. W. F. and A. H. Gibson (ed.) A treatise on dinitrogen fixation. A Willey-Intescience Publication.
Eaglesham, A. R. J., A. Ayanaba, V. R. Rao,
and D. L. Erkew. 1982. Mineral effects on cowpea and soybean crops
in Nigerian soil: I. Development, nodulation acetylene reduction and grain
yield. Plant and Soil 68:171-178.
_______,1982. Mineral effects on cowpea and soybean crops in Nigerian soil: II.
Amounts of N fixed and accrual to the soil.
Plant and Soil 68:183-192.
Eaglesham, A. R.
J. 1981. Assessing the nitrogen contribution of cowpea (Vigna unguiculata)
in monoculture and intercropped. p.
641-646 In Graham, P. H. and S. C. Harris.(ed.) Biological nitrogen fixation technology for
tropical agriculture. Papers presented
at a workshop held at Ciat, March 9-13, 1981.
Cali, Colombia, Centro International de Agricultura Tropical.
Fiedler, R., and G. Proksch. 1972.
Emissionspectrometry for routine analysis of 15N in
agriculture. Plant and Soil 36:371-372.
Fried, M., and B. Hans. 1975.
An independent measurement of the amount of nitrogen fixed by a legume
crop. Plant and Soil 43: 707-711.
Fried, M., and V. Middleboe. 1977.
Measurement of amount of nitrogen fixed by a legume crop. Plant and Soil 47:713-715.
Graham, R. A., and A.L. Donawa. 1981.
Effect of soil pH and inoculum rate on shoot weight, nitrogenase
activity and competitive nodulation of groundnut. Trop. Agric. 58:337-340.
Gibson, A. H., B. L. Dreyfus, and Y. R.
Dommergues. 1982. Nitrogen fixation by legumes in the
tropics. p. 37-71 In Dommergues,
Y. R. and H. G. Diem. (ed.) Microbiology of tropical soils and plant
productivity. Martinus Nijhoff/Dr W.
Junk Publishers, The Hague.
Hadad, D1. A., T. E. Loynachan, and M. M.
Musa. 1982. Inoculation trials on groundnuts (Arachis hypogaea)
in Sudan. p. 249-256 In Graham,
P. H. and S. C. Harris. (ed.) Biological nitrogen fixation, technology for
tropical agriculture. Papers presented
at a workshop held at CIAT, March 9-13, 1981.
Cali, Colombia, Centro Internacional de Agricultura Tropical.
Harper, J. E., J. C. Nicholas, and R. H.
Hageman. 1972. Seasonal and canopy variation in nitrate
reductase activity of soybeans varieties.
Crop Science 12:382-386.
Kang, B. T., N. Nangju, and A. Ayanaba. 1975.
Effects of fertilizer use on cowpea and soybean nodulation and nitrogen
fixation in the lowland tropics. p.
204-216 In Ayanaba, A. and P. J. Dart.(ed.) Biological nitrogen fixation
in farming systems of the tropics.
Based on papers presented at a Symposium held at the International
Institute of Tropical Agriculture, Ibadan, Nigeria, in October, 1975.
Larue, T. A. and T. G. Patterson. 1981.
How much nitrogen do legumes fix? p.15-38 In Brady, N. C.(ed.)
Advances in Agronomy vo1.34 1981 Academic Press. Inc.
Lathwell, D. J. and C. E. Evans. 1952.
Nitrogen uptake from solution by soybeans at successive stages of
growth. Agron. J. 43:175-179
McAuliffe, C., D. S. Chamblee, H.
Uribe-Arango, and W. W. Woodhouse, Jr. 1958.
Influence of inorganic nitrogen on nitrogen fixation by legumes as
revealed by 15N. Agron. J.
50:334-337.
Mughoghc, S. K., J. Awai, H. S. Lowendolf,
and D. J. Lothwell. 1982. The effects of fertilizer nitrogen and
rhizobium inoculation on the yield of cowpeas and subsequent crops of corn. p. 297-301 In Graham, P. H. and S. C.
Harris. (ed.) Biological nitrogen fixation technology for tropical
agriculture. Papers presented at a
workshop held at CIAT, March 9-13, 1981. Cali, Colombia, Certro Internacional
de Agricultura Tropical.
Nambiar, P. T. C., P. J. Dart, B. Srinivasa
Rao, and H. H. Ravishankar. 1982. Response of groundnut (Arachis hypogaea)
to inoculation. p. 241-248 In
Graham, P. H. and S. C. Harris. (ed.)
Biological nitrogen fixation technology for tropical agriculture. Papers presented at a workshop held at CIAT,
March 9-13, 1981. Cali, Colombia,
Centro Internacional de Agricultura Tropical.
_______, M. R. Rao, M. S. Reddy, C. Floyd, P.
T. Dart, and R. W. Willey. 1982.
Nitrogen fixation by groundnut in intercropped and rotational
systems. p. 647-652 In Graham,
P. H and S. C. Harris. (ed.) Biological nitrogen fixation technology for
tropical agriculture. Papers presented
at a workshop held at CIAT, March 9-13, 1981.
Cali, Colombia, Centro Internacional de Agricultura Tropical.
_______, H. N.
Ravishankar, and P. J. Dart. 1983. Effect of rhizobium numbers on nodulation
and N2 fixation in peanut.
Expl. Agric. 19:243-256.
Narwal, S. S., D. S.
Malik, and R. S. Malik. 1983. Effects of preceeding grain legumes on the
requirement of wheat. Exgl. Agric.
19:143-151.
Nelson, A. N., and R. W.
Weaver. 1980. Seasonal nitrogen accumulation and fixation
by soybeans grown at different densities.
Agron. J. 72:613-616.
Norman, M. J. T. 1982.
The role of legumes in tropical agriculture. p. 9-26 In Graham, P. H. and S. C. Harris. (ed.)
Biological nitrogen fixation technology for tropical agriculture. Papers presented at a Workshop held at CIAT,
Colombia, Centro Internacional de Agricultura Tropical.
Okigbo, D. N. 1975.
Legumes in farming systems of the humid tropics. p. 60-71 In Ayanaba, A. and P. J.
Dart. (ed.) Biological nitrogen fixation in farming systems of the
tropics. Papers presented at a
Symposium held at the International Institute of Tropical Agriculture, Ibadan,
Nigeria, in October, 1975.
Philip, S. T., and E. G.
Jaworski. 1975. Patterns of nitrogen utilization in the soybeans. Soil Sci. 73:231-235.
Proksch, G.
1969. Routine analysis of 15N
in plant materials by mass spectrometry.
Plant and Soil 31:380-384.
Rachie, K. O. 1975. The nutritional
role of grain legumes in the lowland humid tropics. p. 45-59 In Ayanaba, A. and P. J. Dart. (ed.) Biological
nitrogen fixation in farming systems of the tropics. Papers presented at a Symposium held at the International
Institute of tropical Agriculture, Ibadan, Nigaria, in October, 1975.
Rao, M. M. and K. C. Sharma. 1978.
Balance of soil nitrogen and phosphorus as influenced by cropping
sequences and fertilizer constraints. Journal of the Indian Society of Soil
Science. (1978) 26 (1) 44-48.
Rennie, R. J. 1982. Quantifying
dinitrogen (N2) fixation in soybeans by 15N isotope
dilution: The question of the non-fixing control plant. Can. J. Bot. 60:856-861.
_______.
1984. Comparison of N balance
and 15N isotope dilution to quantify N2
fixation in field-grown legumes. Agron.
J. 76:785-790.
_______, and S.
Dubetz. 1984. Multistrain vs. single strain rhizobium japonicum inoculants for
early maturing ( 00 and 000 ) soybean cultivars: N2 fixation
quantified by 15N isotope dilution. Agron. J. 76:498-502.
_______, _______, J. B. Bole, and H. H.
Muendel. 1982. Dinitrogen fixation measured by 15N
isotope dilution in two Canadian soybean cultivars. Agron. J. 74:725-730.
_______, and G. A.
Kemp. 1983a. N2 fixation in field beans quantified by 15N
isotope dilution. I. Effect of
strains of Rhizobium phaseoli.
Agron. J. 75:640-644.
_______, and
_______. 1983b. N2-fixation in field beans
quantified by 15N isotope dilution. II. Effect of cultivars of beans. Agron. J. 75:645-649.
_______, and _______. 1984. 15N-determined
time course for N2-fixation in two cultivars of field beans. Agron. J. 76:146-154.
Sen, D., and R. W. Weaver. 1981.
A comparison of nitrogen fixing ability of peanut, cowpea and siratro
plants nodulated by different strains of rhizobia. Plant and Soil 60:317-319.
Talbott, H. J., W. J. Kenworthy, and J. O.
Legg. 1982. Field comparison of the 15N and difference
methods of measuring nitrogen fixation.
Agron. J. 74: 799-804.
Vasilas, B. L., and G. E. Ham. 1984.
Nitrogen fixation in soybeans: An evaluation of measurement techniques. Agron. J. 76:759-764.
Vasios, B. L. 1982. A tracer technique
for quantification of symbiotic nitrogen fixation by soybeans. Dissertation abstracts Int. B. 42 (12) 4642.
Vest, G.
1971. Nitrogen increase in a
non-nodulating soybean genotype grown with nodulating genotype. Agron. J. 63:356-359.
Vose, P. B., A. P. Ruschel, R. L. Victoria,
S. M. T. Saito, and E. Matsui. 1981. 15N
as a tool in biological nitrogen fixation research. p. 575-592 In Graham, P. H. and S. C.
Harris. (ed.) Biological nitrogen fixation technology for tropical
agriculture. Papers presented at a
workshop held at CIAT, March 9-13, 1981.
Cali, Colombia, Centro Internacional de Agricultura Tropical.
Witty, J. F.
1983. Estimating N2-fixation
in the field using 15N-labelled fertilizer: Some problems and
solutions. Soil Biol. Biochem.15: 631-639.